Managing Alerts
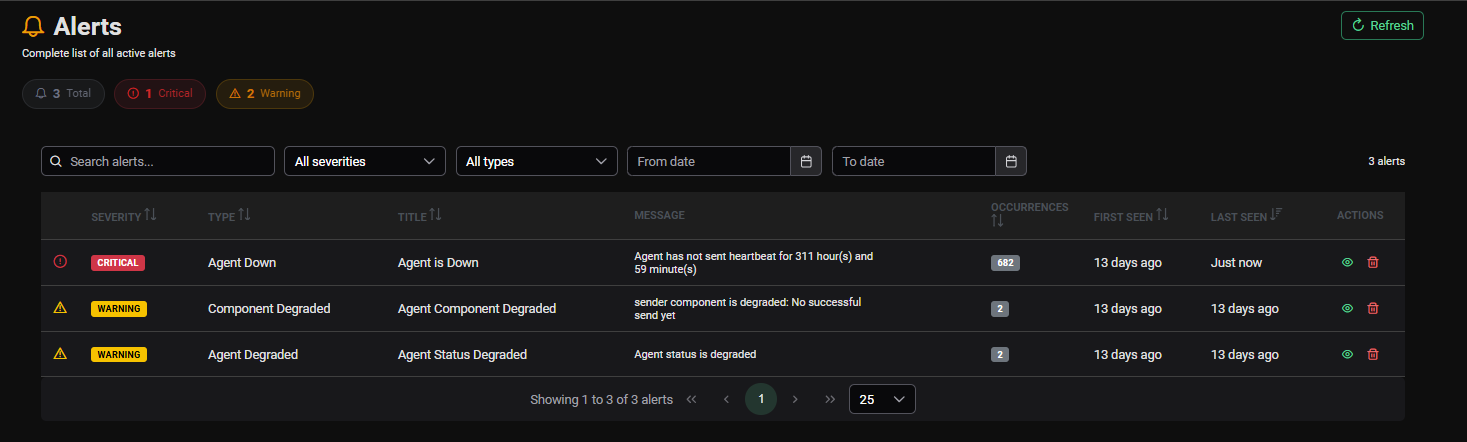
The Alerts page provides a centralized list of all active alerts generated across your monitored PostgreSQL fleet. It includes filtering, search, pagination and a detail dialog for each alert.
Quick Stats
At the top of the page, three stat chips summarize the current alert state:
| Chip | Description |
|---|---|
| Total | Total number of active alerts |
| Critical | Number of CRITICAL severity alerts — visible only if > 0 |
| Warning | Number of WARNING severity alerts — visible only if > 0 |
Filters & Search
A toolbar above the table provides multiple filtering options:
| Filter | Description |
|---|---|
| Search | Free-text search on alert title, type and message |
| Severity | Filter by severity — CRITICAL or WARNING |
| Type | Filter by alert type (e.g. Agent Down, Agent Degraded, Component Degraded) |
| From Date | Show only alerts first seen after this date |
| To Date | Show only alerts last seen before this date |
When any filter is active, a Reset filters button appears to clear all filters at once. The result count shows how many alerts match the current filter, with the total count in parentheses when filtered.
Alert Table
The table lists all active alerts, sorted by Last Seen (most recent first) by default. All columns are sortable.
| Column | Description |
|---|---|
| (icon) | Severity icon — visual indicator |
| Severity | Alert severity badge — CRITICAL or WARNING |
| Type | Alert type label (e.g. Agent Down, Component Degraded) |
| Title | Short title of the alert |
| Message | Truncated alert message — hover to see full text in a tooltip |
| Occurrences | Number of times this alert has been triggered |
| First Seen | Relative time since first occurrence — hover for exact timestamp |
| Last Seen | Relative time since last occurrence — hover for exact timestamp |
| Actions | View detail (👁) and Delete (🗑️) buttons |
Pagination
The table is paginated with 25 rows per page by default. You can change the page size to 10, 25, 50 or 100 rows per page.
No Alerts State
When no alerts are found and no filters are active, the table displays:
✅ No alerts found — All systems are operating normally!
When no alerts match the active filters, a Reset filters button is displayed in the empty state.
Alert Detail Dialog
Click on any row or the eye icon (👁) to open the full detail dialog for that alert.
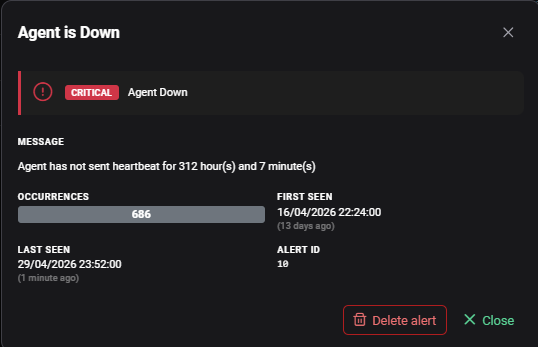
The dialog displays:
| Field | Description |
|---|---|
| Severity | Severity badge with color-coded left border |
| Type | Alert type label |
| Message | Full alert message (not truncated) |
| Occurrences | Total occurrence count |
| First Seen | Exact timestamp + relative time |
| Last Seen | Exact timestamp + relative time |
| Alert ID | Internal unique identifier of the alert |
Dialog Actions
| Button | Description |
|---|---|
| Delete alert | Permanently remove this alert |
| Close | Close the dialog without any action |
Deleting an Alert
Click the delete icon (🗑️) on a table row or the Delete alert button in the detail dialog to remove an alert.
A confirmation dialog is displayed before deletion to prevent accidental removal.
Alert deletion is permanent and cannot be undone. Deleting an alert removes the notification from the platform but does not resolve the underlying condition — if the condition persists, a new alert will be generated.
Refreshing Alerts
Click the Refresh button at the top right of the page to reload the alert list from the backend.
Alert Summary on the Dashboard
The most recent active alerts are also surfaced directly on the Global Dashboard in the Alerts Summary section. See Alerts Summary →.