Top Wait Events
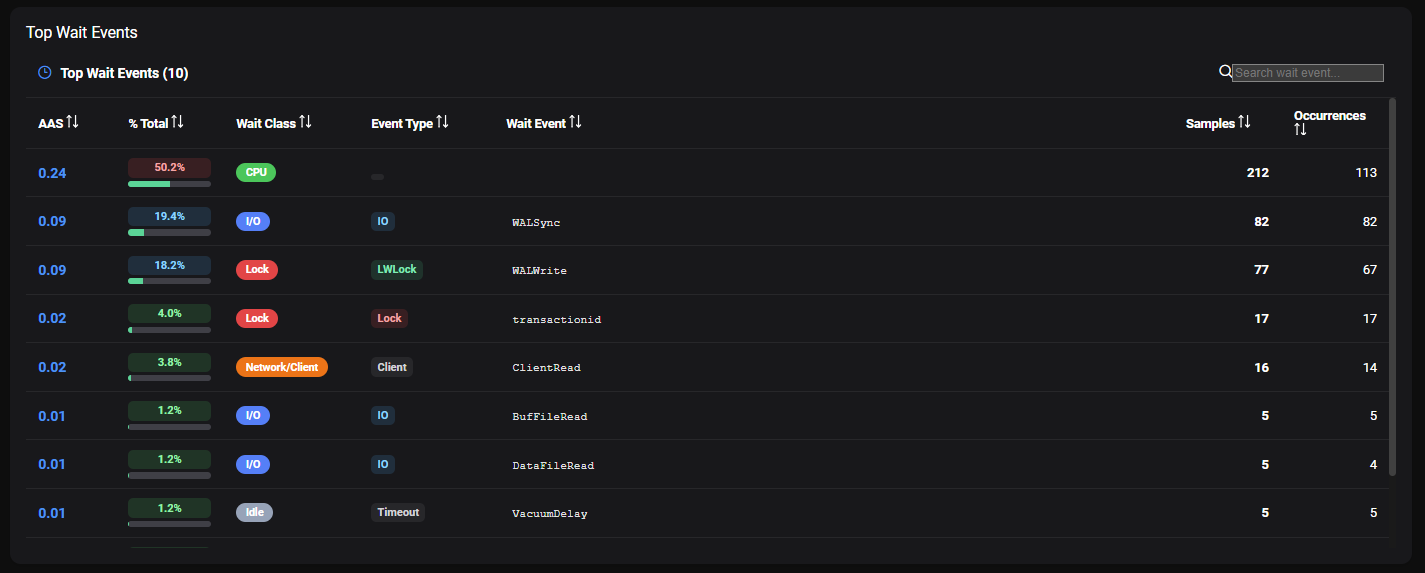
The Top Wait Events panel displays the top 10 wait events observed across all ASH samples in the selected time window. It is a ranked table that helps you understand what your database sessions were waiting for during the selected period.
Understanding Wait Events
In PostgreSQL, a session that is not actively using CPU is in a wait state. PMP4PG captures the wait event type and wait event from pg_stat_activity in every ASH sample, then groups them into Wait Classes for easier analysis.
Wait Class Mapping
| Wait Class | Color | PostgreSQL wait_event_type values |
|---|---|---|
| CPU | 🟢 Green | NULL or empty — session is on CPU |
| I/O | 🔵 Blue | IO |
| Lock | 🔴 Red | Lock, LWLock |
| Network/Client | 🟠 Orange | Client, IPC |
| Idle | ⚪ Gray | Timeout |
| Activity | 🟡 Yellow | Activity |
| Buffer | 🟣 Purple | BufferPin |
| Other | ⚫ Dark Gray | Any other value |
Top Wait Events Table
The table lists up to 10 wait events, sortable by any column:
| Column | Description |
|---|---|
| AAS | Average Active Sessions — average number of sessions in this wait state during the selected period |
| % Total | Percentage of total DB time attributed to this wait event |
| Wait Class | High-level grouping (CPU, I/O, Lock, Network/Client, Idle, Activity, Buffer, Other) |
| Event Type | PostgreSQL wait_event_type value (e.g. IO, LWLock, Lock, Client, Timeout) |
| Wait Event | Specific wait event name (e.g. WALWrite, transactionid, ClientRead) |
| Samples | Number of ASH samples with this wait event |
| Occurrences | Number of distinct occurrences observed |
Search
Use the Search wait event box above the table to filter by wait event name or event type.
Known Wait Events Reference
| Wait Class | Event Type | Wait Event | Typical Cause |
|---|---|---|---|
| CPU | — | — | Session actively executing on CPU |
| I/O | IO | DataFileRead | Reading data blocks from disk (cache miss) |
| I/O | IO | DataFileWrite | Writing data blocks to disk |
| I/O | IO | DataFileExtend | Extending a relation file |
| I/O | IO | DataFilePrefetch | Prefetching data blocks |
| I/O | IO | WALWrite | Writing WAL records to disk |
| I/O | IO | WALSync | Syncing WAL to disk (fsync) |
| I/O | IO | WALInitSync | Initializing a new WAL segment |
| I/O | IO | BufFileRead | Reading from a temporary buffer file |
| I/O | IO | BufFileWrite | Writing to a temporary buffer file |
| Lock | Lock | relation | Waiting for a table-level lock |
| Lock | Lock | transactionid | Waiting for another transaction to commit |
| Lock | Lock | tuple | Waiting for a row-level lock |
| Lock | LWLock | WALInsert | Contention inserting WAL records |
| Lock | LWLock | WALWrite | Contention writing WAL |
| Lock | LWLock | BufferContent | Contention accessing a buffer page |
| Lock | LWLock | ProcArray | Contention on the process array |
| Lock | LWLock | LockManager | Contention on the lock manager |
| Lock | LWLock | XidGen | Contention generating transaction IDs |
| Lock | LWLock | XactSLRU | Contention on transaction status cache |
| Network/Client | Client | ClientRead | Waiting for client to send data |
| Network/Client | IPC | XactGroupUpdate | Waiting for group transaction commit |
| Idle | Timeout | VacuumDelay | Autovacuum cost-based delay |
| Idle | Timeout | VacuumTruncate | Waiting to truncate relation after vacuum |
| Idle | Timeout | PgSleep | Session sleeping (pg_sleep()) |
| Idle | Timeout | SpinDelay | Spinlock retry delay |
| Other | Extension | Extension | Wait event from a PostgreSQL extension |
Reading the Results
Predominantly CPU
A high AAS on CPU with no significant waits indicates a compute-bound workload. This is healthy for analytical queries but may signal missing indexes for OLTP workloads.
High Lock Waits
Lock contention (transactionid, relation, tuple) indicates sessions blocking each other. Keep transactions short and investigate long-running transactions.
High WALWrite / WALSync Waits
Sessions waiting on WAL writes suggest the WAL disk is a bottleneck. Consider a dedicated WAL volume or review synchronous_commit settings.
High ClientRead Waits
Sessions waiting for the client indicate the application is slow to send queries or consume results — investigate the application layer, not the database.
High VacuumDelay Waits
Autovacuum is running but being throttled by cost-based delay settings. If bloat is accumulating, consider increasing autovacuum_vacuum_cost_limit.