Checkpoint & WAL Statistics
The Checkpoint & WAL Statistics section analyzes checkpoint activity, Write-Ahead Log (WAL) generation and background writer performance during the report period. These metrics are critical for understanding write I/O pressure, recovery time and replication health.
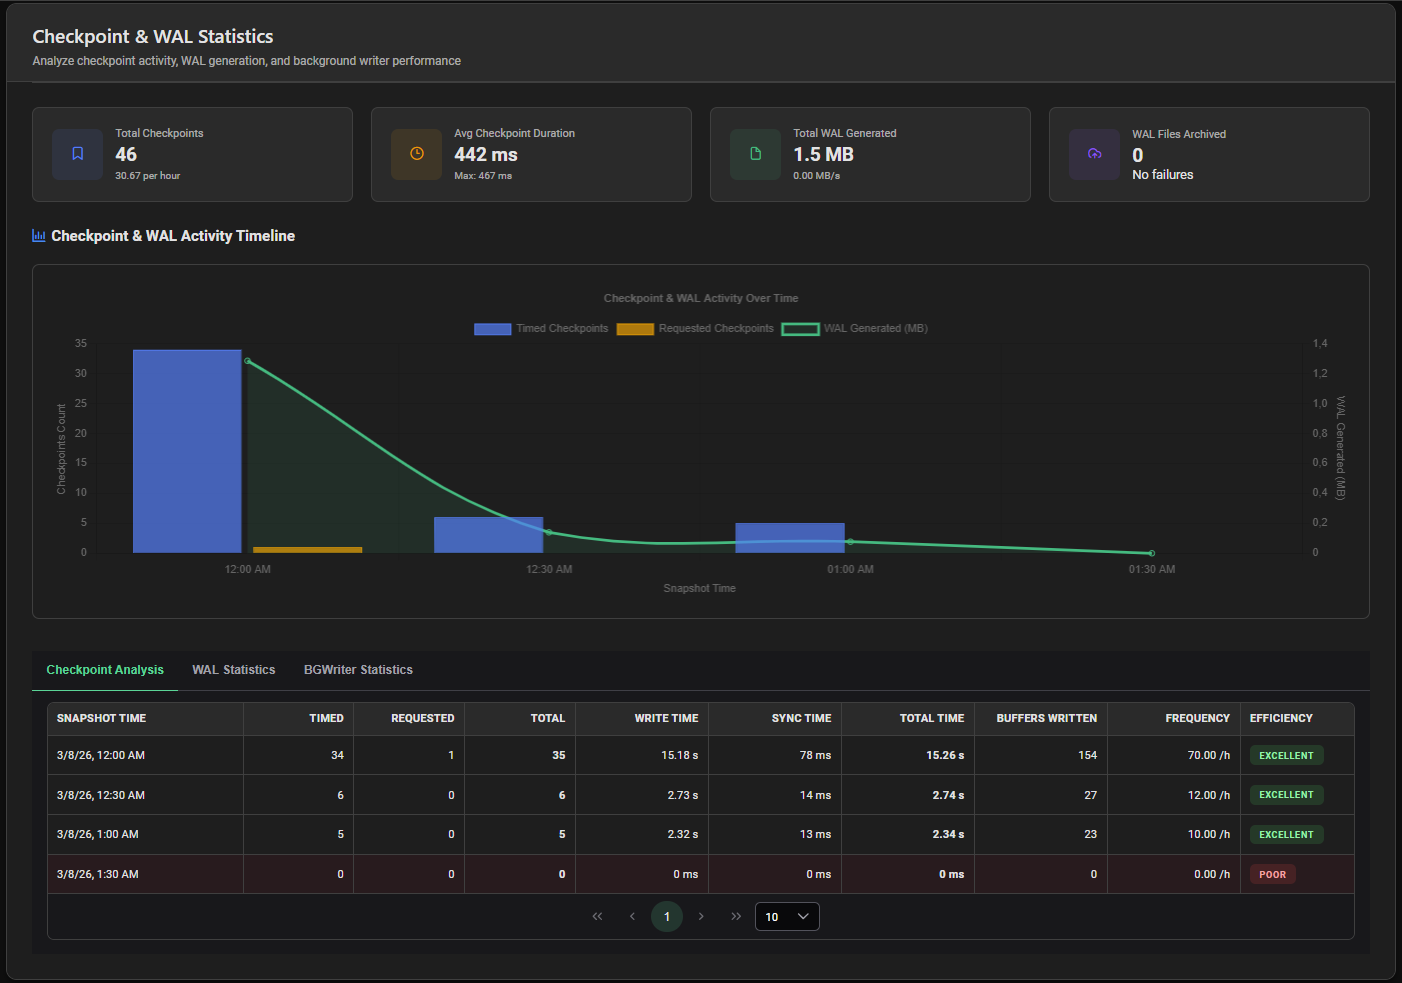
Summary Cards
| Card | Description |
|---|---|
| Total Checkpoints | Total number of checkpoints + frequency per hour |
| Avg Checkpoint Duration | Average checkpoint duration + maximum observed — highlighted orange if slow checkpoints detected |
| Total WAL Generated | Total WAL volume in bytes + average generation rate in MB/s |
| WAL Files Archived | Total WAL files archived + archive failure count — highlighted orange if failures detected |

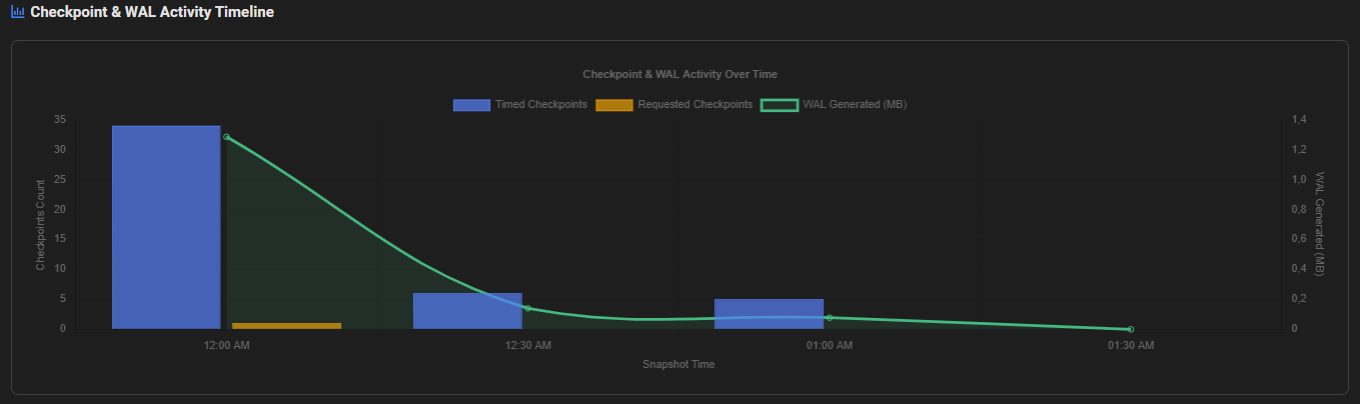
Checkpoint & WAL Activity Timeline
A bar chart showing checkpoint and WAL generation activity over the report period, making it easy to correlate checkpoint spikes with WAL volume peaks.
Tab 1 — Checkpoint Analysis
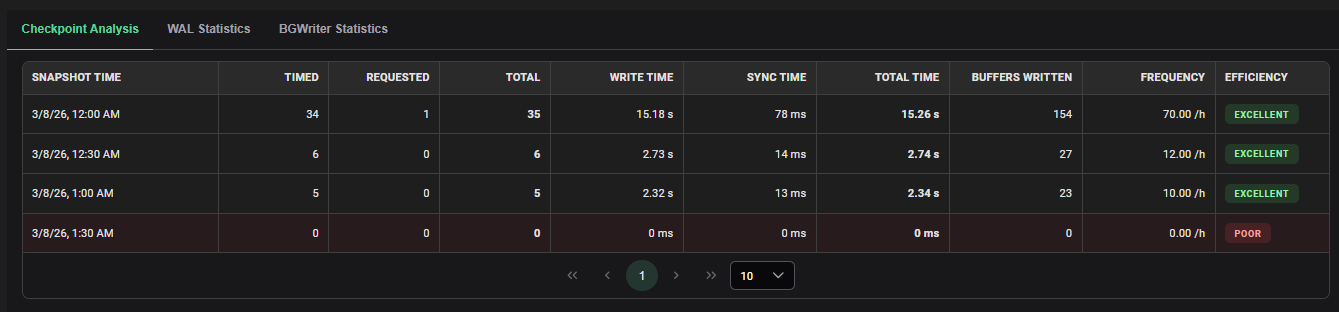
Per-snapshot breakdown of checkpoint activity.
| Column | Description |
|---|---|
| Snapshot Time | Timestamp of the snapshot interval |
| Timed | Checkpoints triggered by checkpoint_timeout |
| Requested | Checkpoints triggered by WAL volume (max_wal_size) |
| Total | Total checkpoints in this snapshot interval |
| Write Time | Time spent writing dirty buffers to disk |
| Sync Time | Time spent syncing files to disk (fsync) |
| Total Time | Total checkpoint duration (Write + Sync) |
| Buffers Written | Number of dirty buffers written during checkpoints |
| Frequency | Checkpoint frequency per hour |
| Efficiency | Checkpoint efficiency badge |
Checkpoint Efficiency Levels
| Efficiency | Badge | Meaning |
|---|---|---|
| High | 🟢 Green | Checkpoints complete quickly with low I/O impact |
| Good | 🔵 Blue | Normal checkpoint performance |
| Low | 🟠 Orange | Checkpoints are slow — investigate I/O subsystem |
| Critical | 🔴 Red | Checkpoints are severely impacting performance |
Key Indicators
High Requested vs. Timed Checkpoints — WAL is being generated faster than checkpoint_timeout allows. Increase max_wal_size to space out checkpoints:
max_wal_size = 2GB # increase from default 1GB
High Sync Time — fsync operations are slow, indicating disk I/O bottleneck on the WAL or data volume. Consider a dedicated WAL disk or faster storage.
High Buffers Written at Checkpoint — too many dirty buffers accumulate between checkpoints. Tune checkpoint_completion_target to spread writes:
checkpoint_completion_target = 0.9
Tab 2 — WAL Statistics
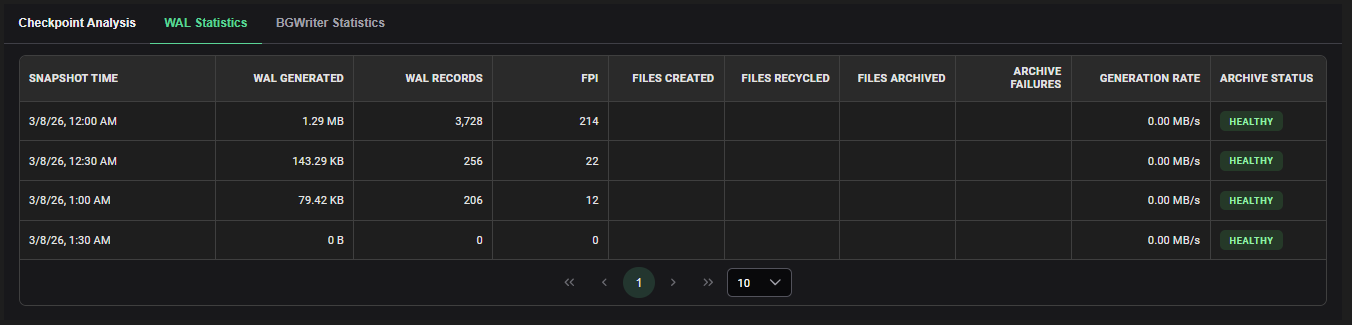
Per-snapshot breakdown of WAL generation activity.
| Column | Description |
|---|---|
| Snapshot Time | Timestamp of the snapshot interval |
| WAL Generated | Total WAL volume generated during this interval |
| WAL Records | Number of WAL records written |
| FPI | Full Page Images written — increases after each checkpoint |
| Files Created | New WAL segment files created |
| Files Recycled | WAL segment files recycled for reuse |
| Files Archived | WAL files sent to the archive |
| Archive Failures | Failed archive operations — highlighted red if > 0 |
| Generation Rate | WAL generation rate in MB/s |
| Archive Status | Archive health badge |
Archive Status Values
| Status | Badge | Meaning |
|---|---|---|
| OK | 🟢 Green | WAL archiving is working normally |
| WARNING | 🟠 Orange | Some archive failures detected |
| FAILED | 🔴 Red | Archive is failing — immediate attention required |
| DISABLED | ⚪ Gray | WAL archiving is not configured |
Archive failures mean WAL files are not being preserved for Point-in-Time Recovery (PITR). If archiving is required for your recovery strategy, investigate and resolve archive failures immediately — WAL files may be deleted before they are archived.
High FPI (Full Page Images)
A high FPI count relative to WAL records indicates frequent checkpoints. Each checkpoint resets the FPI tracking — more checkpoints = more FPIs = more WAL volume. Reducing checkpoint frequency (via max_wal_size) also reduces FPI overhead.
Tab 3 — BGWriter Statistics
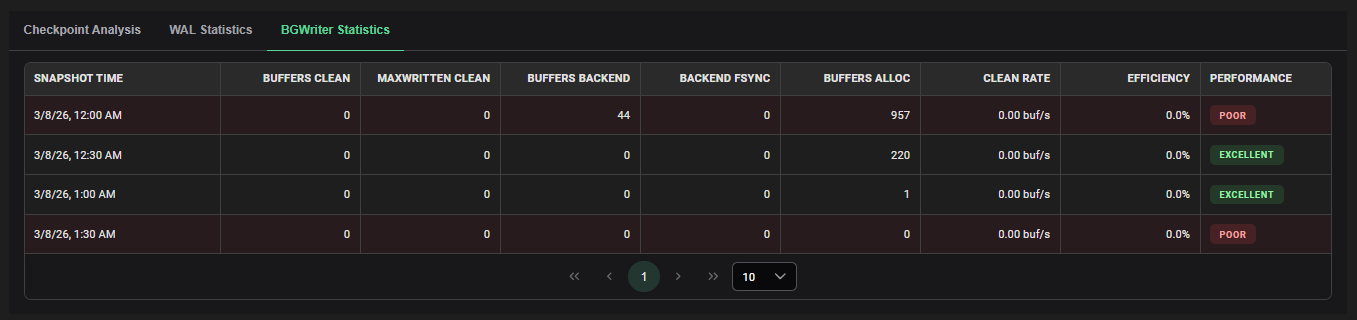
Per-snapshot breakdown of background writer activity.
The background writer (bgwriter) proactively writes dirty buffers to disk between checkpoints, reducing the I/O burst at checkpoint time.
| Column | Description |
|---|---|
| Snapshot Time | Timestamp of the snapshot interval |
| Buffers Clean | Dirty buffers written by the bgwriter |
| Maxwritten Clean | Times bgwriter stopped early due to bgwriter_lru_maxpages limit |
| Buffers Backend | Dirty buffers written directly by backend processes (not bgwriter) |
| Backend Fsync | Times backends had to perform fsync themselves |
| Buffers Alloc | New buffers allocated |
| Clean Rate | bgwriter throughput in buffers per second |
| Efficiency | Percentage of writes handled by bgwriter vs. backends |
| Performance | Overall bgwriter performance badge |
Interpreting BGWriter Statistics
High Buffers Backend (vs. Buffers Clean) Backend processes are writing dirty buffers directly because the bgwriter is not keeping up. This causes latency spikes for user queries. Tune bgwriter aggressiveness:
bgwriter_lru_maxpages = 200      # increase from default 100
bgwriter_delay = 50ms            # decrease from default 200ms
High Maxwritten Clean
The bgwriter is hitting its per-round limit too often. Increase bgwriter_lru_maxpages to allow it to write more buffers per round.
High Backend Fsync Backends are performing fsync themselves — a sign that the bgwriter and checkpoint process cannot keep up with write demand. This is a serious performance concern requiring storage or configuration review.
Interpretation Guide
| Condition | Threshold | Action |
|---|---|---|
| High checkpoint frequency | > 4/hour | Increase max_wal_size |
| High avg checkpoint duration | > 30s | Tune checkpoint_completion_target = 0.9 |
| High WAL generation rate | > 50 MB/s | Investigate high-write workloads in Top SQL |
| WAL archive failures | > 0 | Investigate archive command and storage |
| High Buffers Backend | > 20% of total | Tune bgwriter aggressiveness |