Database Statistics
The Database Statistics section provides per-database activity and performance metrics during the report period. All values are deltas computed between the begin and end snapshots, sourced from pg_stat_database.
A Total row at the bottom aggregates all databases for a fleet-wide view.
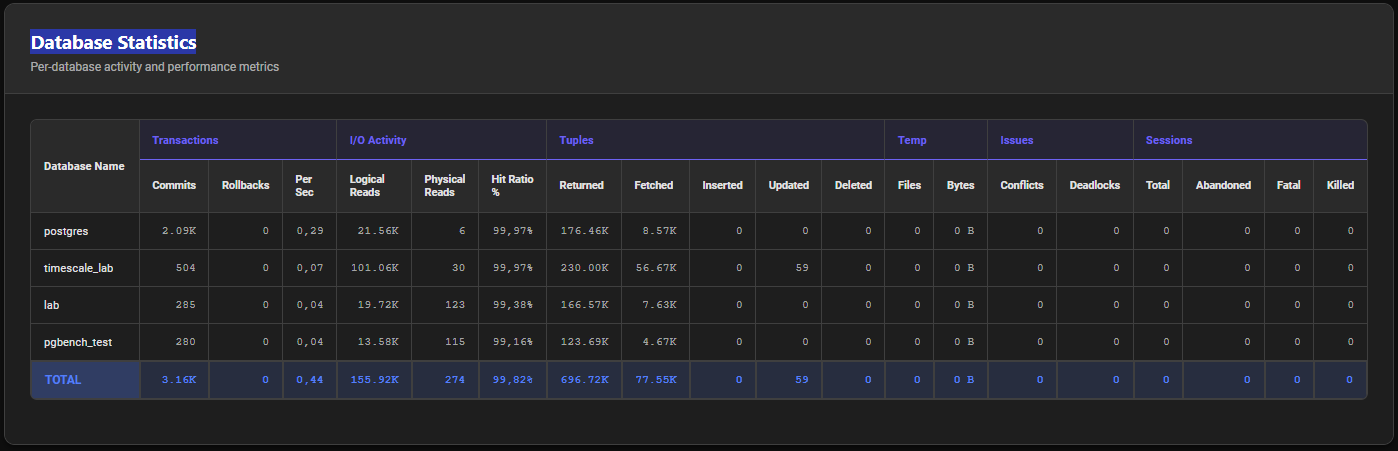
Statistics Table
The table is organized into 6 column groups:
Transactions
| Column | Description |
|---|---|
| Commits | Total committed transactions |
| Rollbacks | Total rolled-back transactions |
| Per Sec | Transactions per second (TPS) |
I/O Activity
| Column | Description |
|---|---|
| Logical Reads | Total blocks read from the buffer cache |
| Physical Reads | Total blocks read from disk (cache misses) |
| Hit Ratio % | Buffer cache hit ratio — color-coded |
Tuples
| Column | Description |
|---|---|
| Returned | Total rows returned by queries |
| Fetched | Total rows fetched (after filter) |
| Inserted | Total rows inserted |
| Updated | Total rows updated |
| Deleted | Total rows deleted |
Temp
| Column | Description |
|---|---|
| Files | Temporary files created (sort/hash spills to disk) |
| Bytes | Total size of temporary files |
Issues
| Column | Description |
|---|---|
| Conflicts | Query conflicts — typically occurs in replication scenarios |
| Deadlocks | Number of deadlocks detected — highlighted red if > 0 |
Sessions
| Column | Description |
|---|---|
| Total | Total sessions connected during the period |
| Abandoned | Sessions that disconnected unexpectedly |
| Fatal | Sessions terminated with a fatal error |
| Killed | Sessions terminated by pg_terminate_backend() |
Total Row
The last row of the table aggregates all databases, providing an instance-wide summary. The Hit Ratio % in the total row reflects the overall buffer cache efficiency across all databases.
Automatic Notes
Contextual notes are displayed below the table when specific conditions are detected:
| Condition | Note |
|---|---|
| Buffer Hit Ratio < 95% | Recommendation to increase shared_buffers if consistently below 95% |
| Deadlocks > 0 | Warning to review application locking patterns and transaction isolation levels |
| Conflicts > 0 | Note about replication conflicts or isolation level issues |
How to Read This Section
Identifying the Most Active Databases
Sort by Per Sec (TPS) or Logical Reads to identify which databases drive the most workload on the instance. In a multi-tenant deployment, this immediately reveals which tenants are most active.
Detecting Write-Heavy Databases
Compare Inserted + Updated + Deleted (write tuples) against Returned + Fetched (read tuples). A high write-to-read ratio indicates a write-intensive workload — ensure autovacuum is adequately tuned for those databases.
Temporary Files
Any non-zero Temp Files value indicates queries spilling to disk during sort or hash operations. This degrades performance and generates additional I/O. Investigate with:
-- Find queries generating temp files
SELECT query, temp_blks_read, temp_blks_written
FROM pg_stat_statements
WHERE temp_blks_written > 0
ORDER BY temp_blks_written DESC
LIMIT 10;
Consider increasing work_mem for sessions generating temp files, or optimize the queries with appropriate indexes.
Session Issues
- Abandoned sessions — application connection handling issues (missing connection pool, network drops)
- Fatal sessions — server-side errors (out of memory, disk full, max_connections reached)
- Killed sessions — manual intervention via
pg_terminate_backend()or connection pool timeout enforcement