Instance Efficiency Ratios
The Instance Efficiency Ratios section provides key performance indicators that measure how efficiently the PostgreSQL instance is operating during the report period. Each ratio is displayed as a card with a status badge, a progress bar and a recommendation.
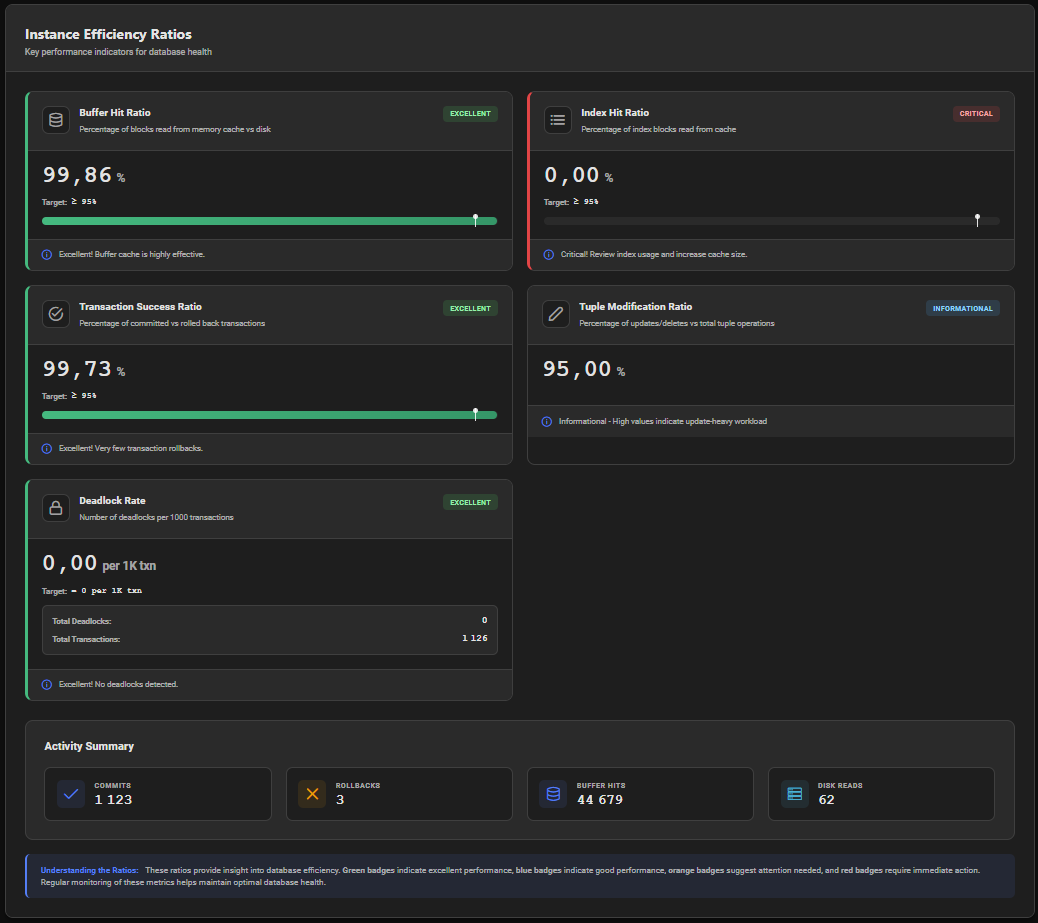
Efficiency Ratio Cards
Each ratio is evaluated against a target threshold and assigned a status:
| Badge | Severity | Meaning |
|---|---|---|
| 🟢 Excellent | Green | Ratio meets or exceeds the target — optimal performance |
| 🔵 Good | Blue | Ratio is within acceptable range |
| 🟠 Warning | Orange | Ratio is below target — attention recommended |
| 🔴 Critical | Red | Ratio requires immediate action |
| ⚪ N/A | Gray | Ratio cannot be computed (insufficient data) |
Ratios Explained
Buffer Cache Hit Ratio
Buffer Cache Hit Ratio = Buffer Hits / (Buffer Hits + Disk Reads) × 100
Target: ≥ 95%
Measures the percentage of block reads served from the PostgreSQL buffer cache (shared_buffers) rather than disk.
| Value | Status | Meaning |
|---|---|---|
| ≥ 95% | 🟢 Excellent | Most reads served from memory — optimal |
| 90–95% | 🔵 Good | Acceptable for most workloads |
| 80–90% | 🟠 Warning | Significant disk reads — consider increasing shared_buffers |
| < 80% | 🔴 Critical | Heavy disk I/O — investigate large sequential scans or undersized memory |
Commit Ratio
Commit Ratio = Commits / (Commits + Rollbacks) × 100
Target: ≥ 95%
Measures the proportion of transactions that committed successfully versus rolled back.
A low commit ratio indicates frequent transaction failures — caused by application errors, constraint violations or explicit rollbacks.
Deadlock Rate
Deadlock Rate = Total Deadlocks / Total Transactions
Target: = 0
Any deadlock is undesirable. The card displays the total number of deadlocks and total transactions during the report period. Deadlocks indicate circular lock dependencies between concurrent sessions — investigate application transaction patterns.
Activity Summary
Below the ratio cards, an Activity Summary section provides the raw counts underlying the ratios:
| Metric | Description |
|---|---|
| Commits | Total committed transactions during the report period |
| Rollbacks | Total rolled-back transactions during the report period |
| Buffer Hits | Total block reads served from the buffer cache |
| Disk Reads | Total block reads from disk (cache misses) |

How to Use This Section
The Instance Efficiency Ratios give you a quick health assessment of the database instance for the report period. Use them as entry points for deeper investigation:
-
Low Buffer Cache Hit Ratio → Check Top SQL by I/O for queries reading many blocks from disk. Consider increasing
shared_buffersor adding indexes to avoid large sequential scans. -
Low Commit Ratio → Check application logs for errors. Review the Top SQL section for frequently rolled-back statements.
-
Non-zero Deadlocks → Investigate the Lock Contention Analysis section. Review application transaction ordering to eliminate circular dependencies.