Lock Contention Analysis
The Lock Contention Analysis section provides a detailed view of lock waits and blocking activity during the report period. It helps identify which queries were blocked, which queries caused the most blocking, and which database objects experienced the most contention.
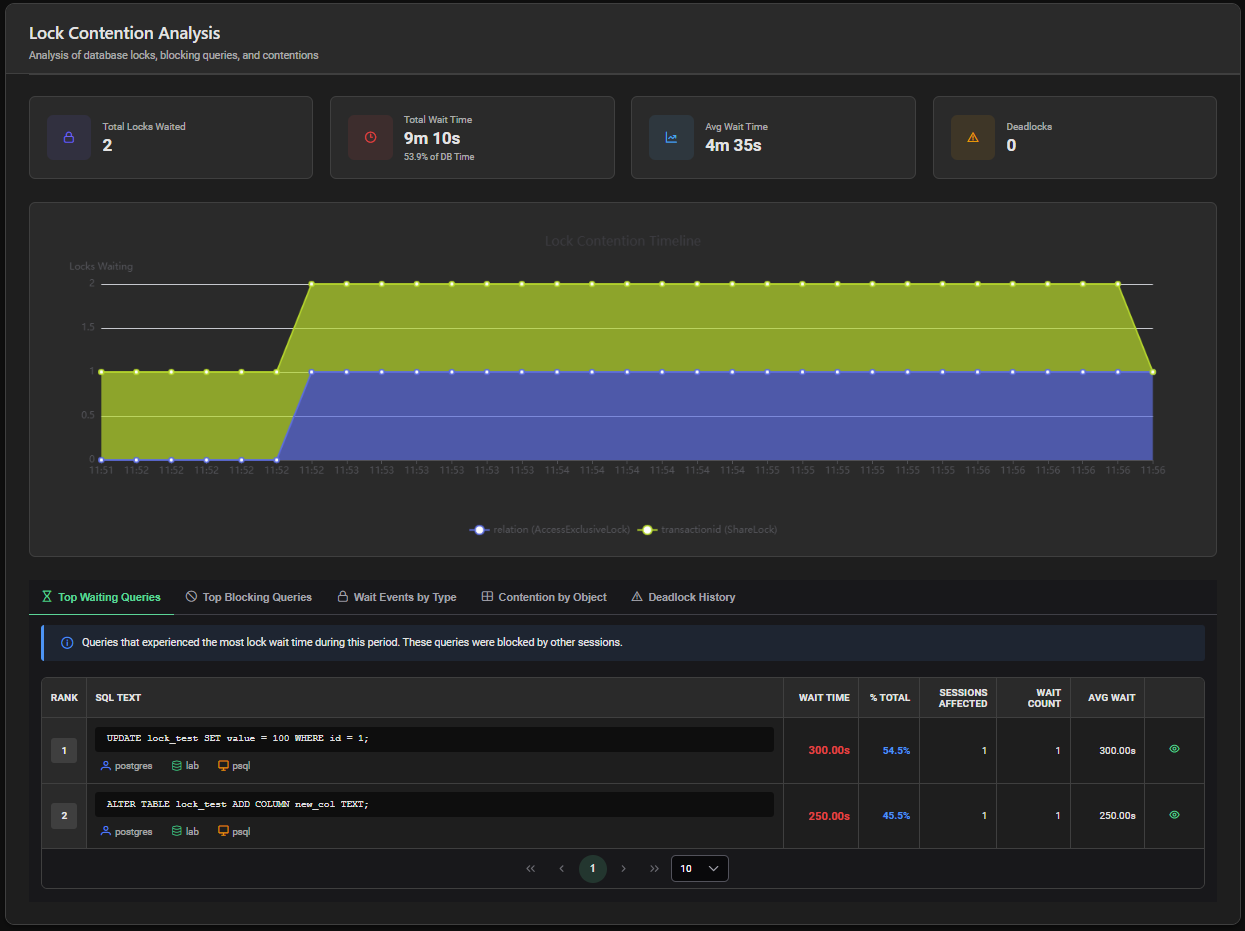
Summary Cards
Four summary cards give an immediate overview of lock activity:
| Card | Description |
|---|---|
| Total Locks Waited | Total number of lock wait events observed during the period |
| Total Wait Time | Cumulative lock wait time — also expressed as a percentage of DB Time |
| Avg Wait Time | Average wait time per lock wait event |
| Deadlocks | Total number of deadlocks detected — card turns orange if > 0 |

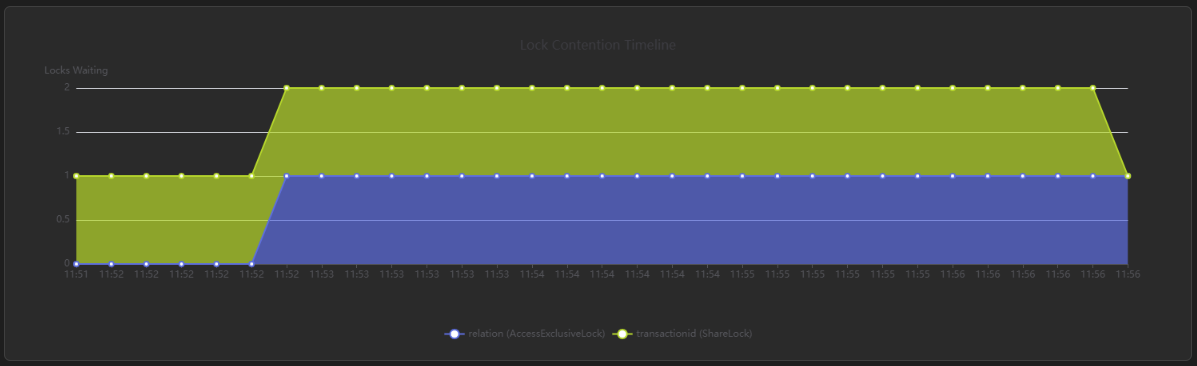
Lock Contention Timeline
A timeline chart shows lock contention activity over the report period, allowing you to identify when contention peaks occurred.
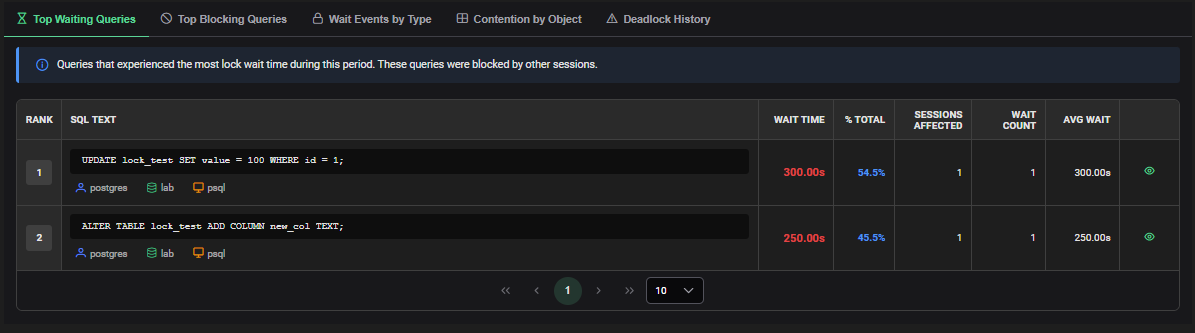
Tab 1 — Top Waiting Queries
Queries that experienced the most lock wait time — sessions that were blocked by other sessions holding locks.
| Column | Description |
|---|---|
| Rank | Position by total wait time |
| SQL Text | Normalized query text (truncated) with User, Database and Application context |
| Wait Time | Total lock wait time in seconds |
| % Total | Share of total lock wait time |
| Sessions Affected | Number of distinct sessions that executed this query and waited |
| Wait Count | Number of wait samples observed |
| Avg Wait | Average wait time per occurrence |
| Details | Opens the Waiting Query Details dialog |
Waiting Query Details Dialog
Click the eye icon to open a detail panel for a waiting query:
- SQL Statement — full query text with copy button
- Metrics — Total Wait Time, Sessions Affected, Wait Count, Avg Wait Time
- Execution Context — User, Database, Application name
- Query Hash — normalized query identifier with copy button
- Recommendations — contextual recommendations based on wait severity
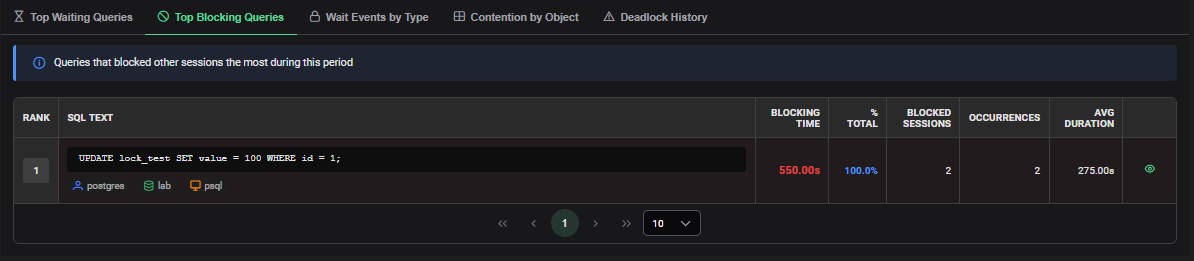
Tab 2 — Top Blocking Queries
Queries that blocked other sessions the most — sessions holding locks that prevented others from progressing.
| Column | Description |
|---|---|
| Rank | Position by total blocking time |
| SQL Text | Normalized query text with execution context |
| Blocking Time | Total time this query blocked other sessions |
| % Total | Share of total blocking time |
| Blocked Sessions | Number of distinct sessions blocked by this query |
| Occurrences | Number of distinct blocking events |
| Avg Duration | Average duration per blocking occurrence |
| Details | Opens the Blocking Query Details dialog |
Blocking Query Details Dialog
- SQL Statement — full query text with copy button
- Metrics — Total Blocking Time, Blocked Sessions, Blocking Occurrences, Avg Duration, Max Duration
- Execution Context — User, Database, Application name
- Query Hash — with copy button
- Recommendations — contextual recommendations based on blocking severity
Tab 3 — Wait Events by Type
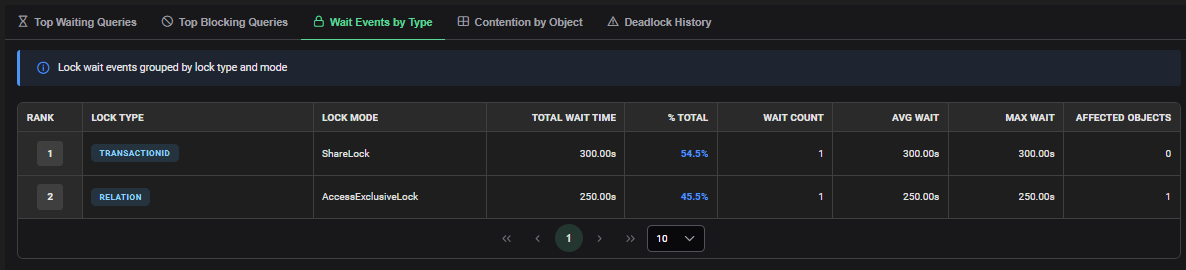
Lock wait events grouped by lock type and lock mode.
| Column | Description |
|---|---|
| Rank | Position by total wait time |
| Lock Type | Type of lock (relation, transactionid, tuple, LWLock, etc.) |
| Lock Mode | Lock mode requested |
| Total Wait Time | Cumulative wait time for this lock type |
| % Total | Share of total lock wait time |
| Wait Count | Number of wait events of this type |
| Avg Wait | Average wait time per event |
| Max Wait | Longest observed wait for this lock type |
| Affected Objects | Number of distinct objects involved |
Tab 4 — Contention by Object
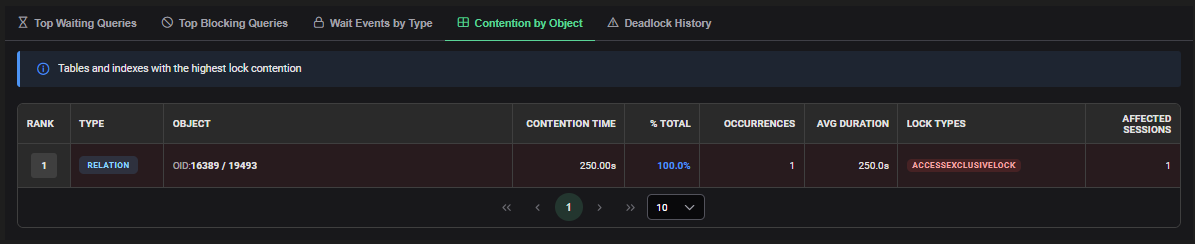
Tables and indexes ranked by total lock contention time.
| Column | Description |
|---|---|
| Rank | Position by contention time |
| Type | Object type (TABLE, INDEX, etc.) |
| Object | Object OID and name |
| Contention Time | Total contention time on this object |
| % Total | Share of total contention time |
| Occurrences | Number of contention events on this object |
| Avg Duration | Average contention duration per event |
| Lock Types | Lock types observed on this object (badges) |
| Affected Sessions | Number of distinct sessions affected |
Tab 5 — Deadlock History
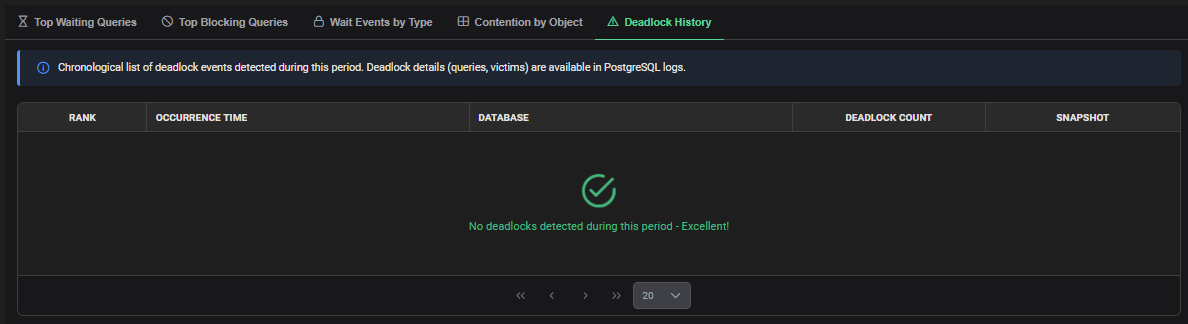
Chronological list of deadlock events detected during the report period.
| Column | Description |
|---|---|
| Rank | Chronological position |
| Occurrence Time | Timestamp of the deadlock event |
| Database | Database where the deadlock occurred |
| Deadlock Count | Number of deadlocks at this timestamp |
| Snapshot | Snapshot ID during which the deadlock was recorded |
Deadlock details (involved queries and victim sessions) are available in the PostgreSQL server logs. Cross-reference the deadlock timestamp with your log files for full investigation.
Interpretation Guide
High Lock Wait as % of DB Time
Lock contention is a significant contributor to database slowness. Review the Top Blocking Queries tab to identify the root cause and shorten transaction durations.
High Avg Wait Time
Sessions are waiting a long time for each lock acquisition. Investigate long-running transactions that hold locks for extended periods.
Frequent transactionid Waits
Sessions are waiting for other transactions to commit or rollback. Ensure transactions are as short as possible and that application error handling includes proper rollback.
Frequent relation or tuple Waits
Row or table level contention. Review lock modes used by concurrent queries — consider SELECT FOR UPDATE SKIP LOCKED for queue-like patterns.
Any Deadlocks > 0
Investigate deadlock patterns in PostgreSQL logs. Ensure consistent lock acquisition order across the application.