Top Dimensions
The Top Dimensions section is the last section of the AWR report. It identifies the most active users, applications and client IP addresses during the report period, based on ASH sample counts. It helps answer the question: who and what was driving the database workload?
Common Columns (all 3 tabs)
All three tabs share the same column structure:
| Column | Description |
|---|---|
| Rank | Position by sample count |
| Value | User name / Application name / Client IP address |
| Sample Count | Number of ASH samples where this dimension was active |
| Avg Active Sessions (AAS) | Average number of active sessions for this dimension |
| % of Total Activity | Share of total ASH activity attributed to this dimension |
Tab 1 — Top Users
Ranks PostgreSQL users by their share of database activity during the report period, sourced from pg_stat_activity.usename.
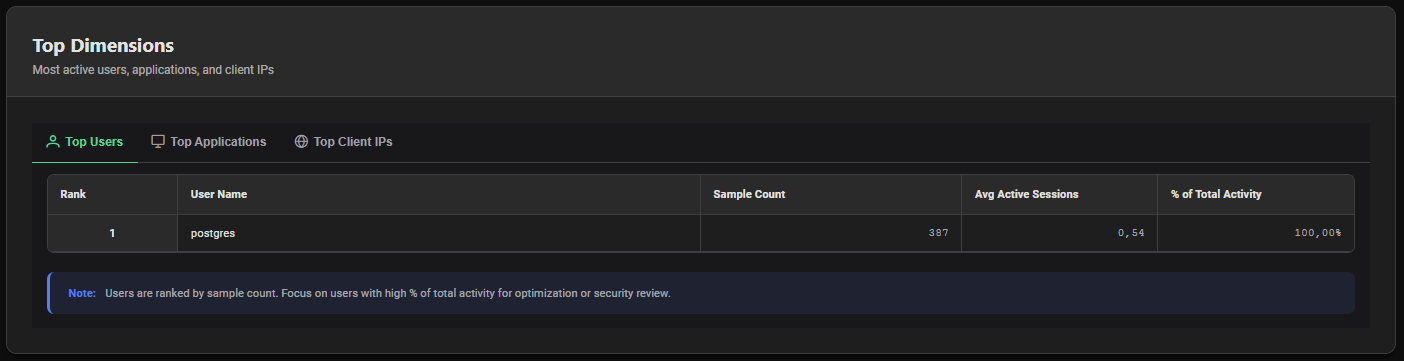
- Performance — Identify which users drive the most workload and target optimization efforts accordingly
- Security — Spot unexpected users with high activity that should not be generating significant database load
- Capacity Planning — Understand which users will be impacted most by resource changes
Tab 2 — Top Applications
Ranks client applications by their share of database activity, sourced from pg_stat_activity.application_name.
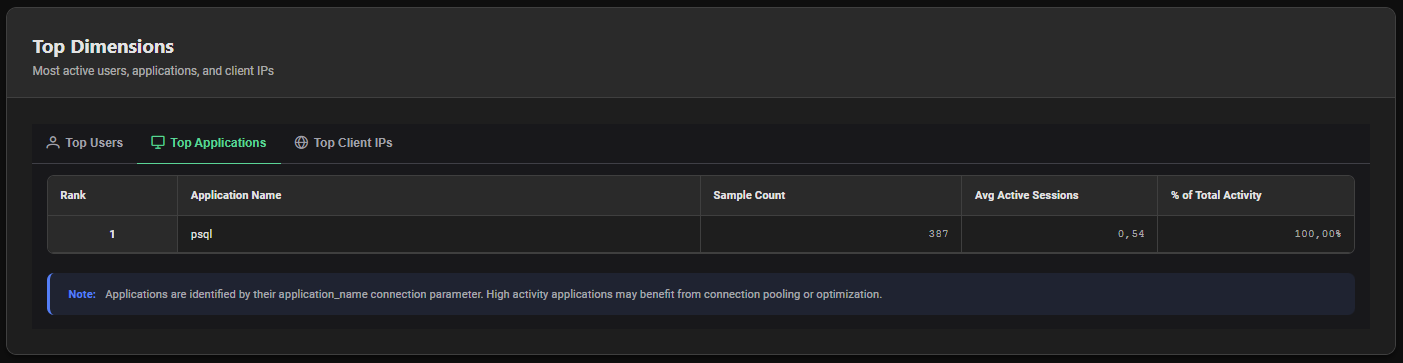
The application name is set by the client at connection time via the application_name connection parameter. Common values include:
| Application Name | Typical Source |
|---|---|
psql | Direct PostgreSQL CLI connections |
pgbench | PgBench load testing tool |
JDBC / jdbc | Java applications using JDBC driver |
pgAdmin | pgAdmin GUI tool |
PMP4PG Agent | PMP4PG monitoring agent |
Empty or Unknown | Application not setting application_name |
Encourage all applications to set a meaningful application_name in their connection string. This makes Top Applications analysis significantly more actionable:
postgresql://user:pass@host/db?application_name=my-app-v2
Applications with high % of total activity are prime candidates for connection pooling (PgBouncer, Pgpool-II) if they open many short-lived connections, or for query optimization review via the Top SQL section.
Tab 3 — Top Client IPs
Ranks client IP addresses by their share of database activity, sourced from pg_stat_activity.client_addr.
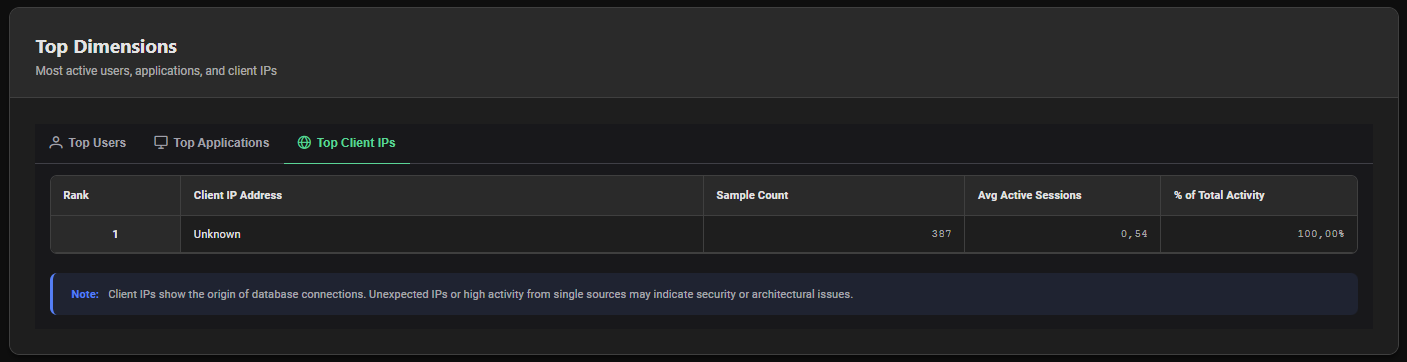
Sessions connecting via Unix socket (local connections) appear as local or with a null client_addr. The PMP4PG agent itself typically appears as a local connection.
Unexpected IP addresses with high activity in this tab may indicate:
- An undocumented application server connecting to the database
- A development or staging environment accidentally connecting to production
- An unauthorized connection attempt that should be blocked at the network or
pg_hba.conflevel
Interpretation Guide
One User Dominates (> 80% of Activity)
Normal in single-application deployments. In multi-tenant environments, investigate whether workload isolation is needed.
Many Unknown Applications
Applications are not setting application_name. This limits the value of this section. Standardize connection strings across the application fleet.
Unexpected Client IPs
Cross-reference with pg_hba.conf and firewall rules. If an IP should not have access to the database, revoke it immediately.
High AAS on a Single Application
A single application is generating disproportionate database load. Investigate its query patterns in Top SQL filtered by that application's user account.