Top SQL Statements
The Top SQL Statements section identifies the SQL queries that consumed the most resources during the report period. It is organized into 4 tabs, each ranking queries by a different dimension. All tabs share the same query data computed from pg_stat_statements deltas between the begin and end snapshots.
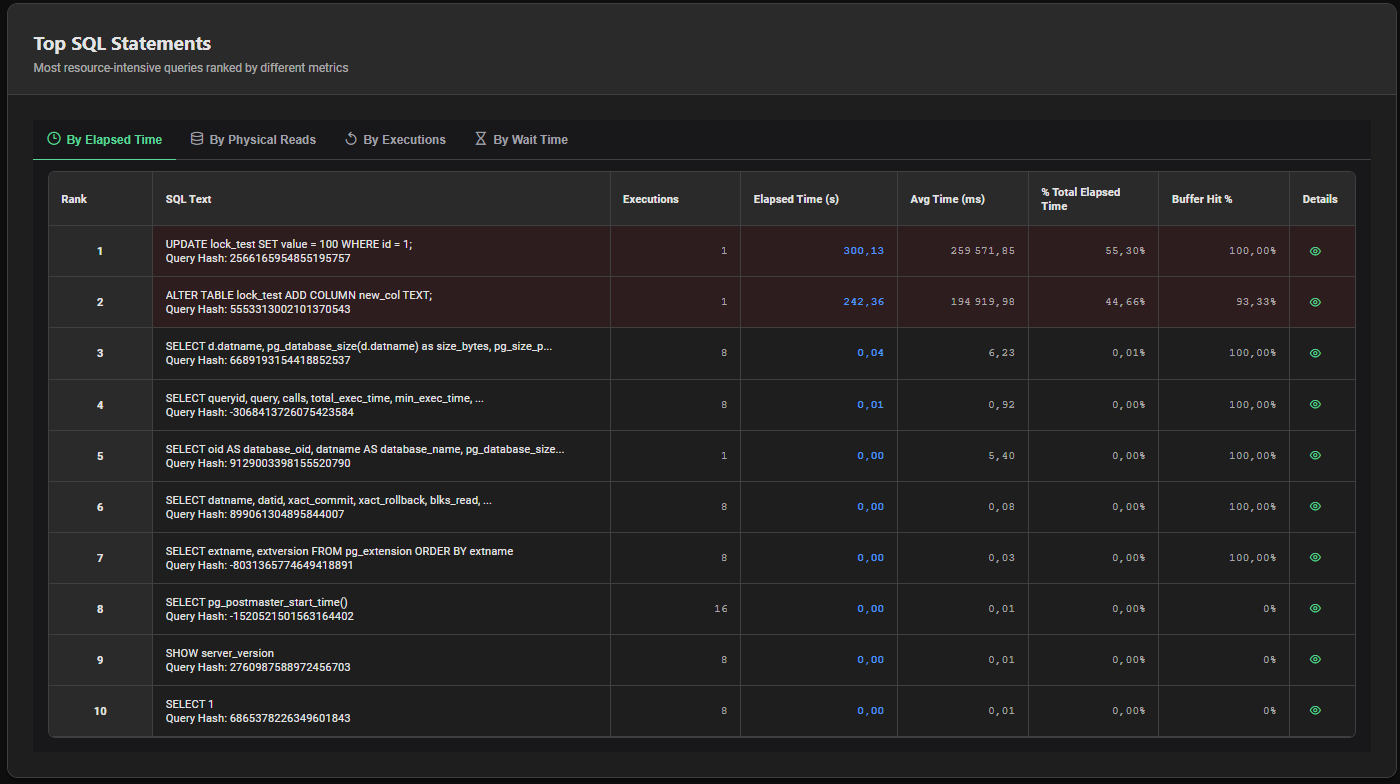
Tab 1 — By Elapsed Time
Ranks queries by total elapsed execution time during the report period.
Best for: Identifying queries that consumed the most total database time — the primary bottleneck indicator.
| Column | Description |
|---|---|
| Rank | Position by total elapsed time |
| SQL Text | Normalized SQL text (truncated to 80 chars) + Query Hash |
| Executions | Number of executions during the report period |
| Elapsed Time (s) | Total elapsed execution time in seconds |
| Avg Time (ms) | Average elapsed time per execution in milliseconds |
| % Total Elapsed Time | Share of total elapsed time across all statements |
| Buffer Hit % | Buffer cache hit ratio for this statement |
| Details | Button to open the SQL detail dialog |
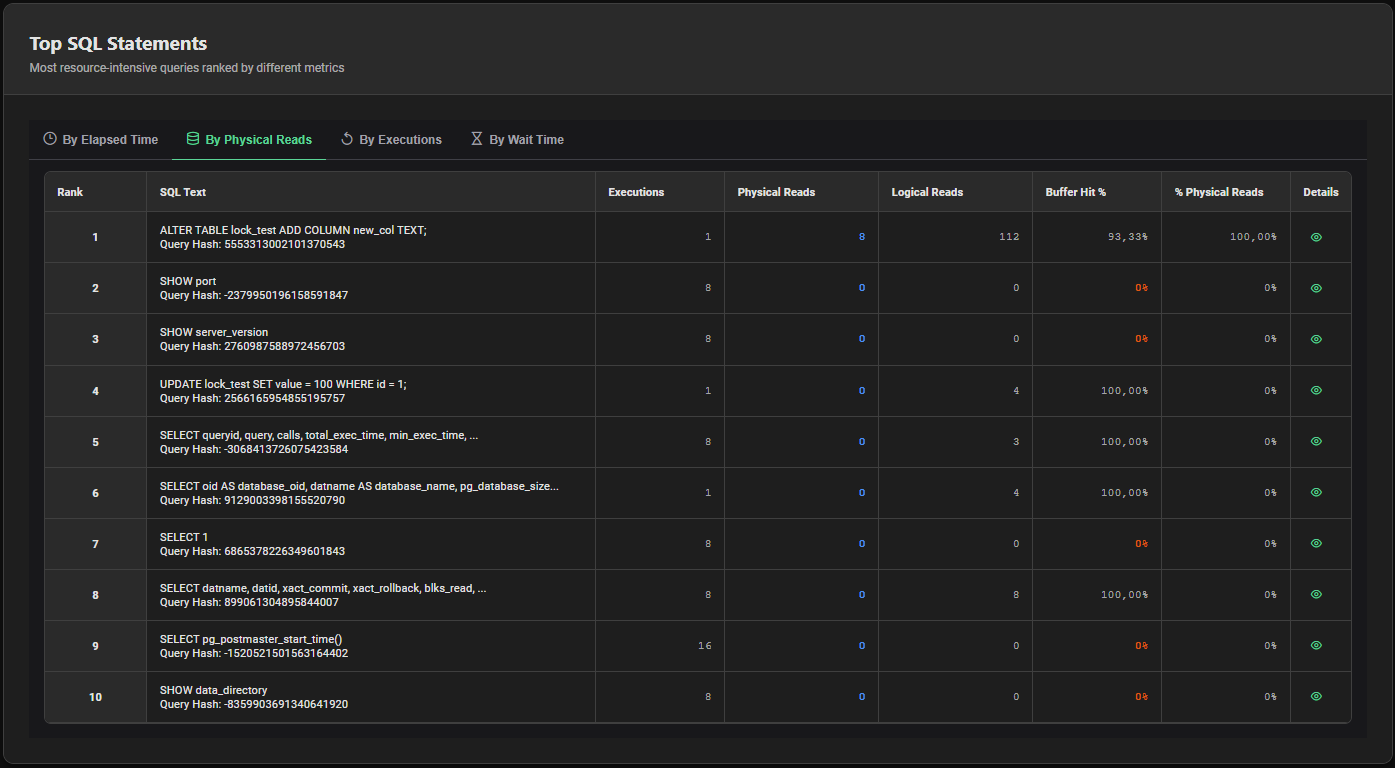
Tab 2 — By Physical Reads
Ranks queries by total number of physical block reads from disk.
Best for: Identifying queries causing the most disk I/O — often missing indexes or large sequential scans.
| Column | Description |
|---|---|
| Rank | Position by physical reads |
| SQL Text | Normalized SQL text + Query Hash |
| Executions | Number of executions |
| Physical Reads | Total blocks read from disk |
| Logical Reads | Total blocks read from buffer cache |
| Buffer Hit % | Buffer cache hit ratio — highlighted in orange if below 90% |
| % Physical Reads | Share of total physical reads across all statements |
| Details | Button to open the SQL detail dialog |
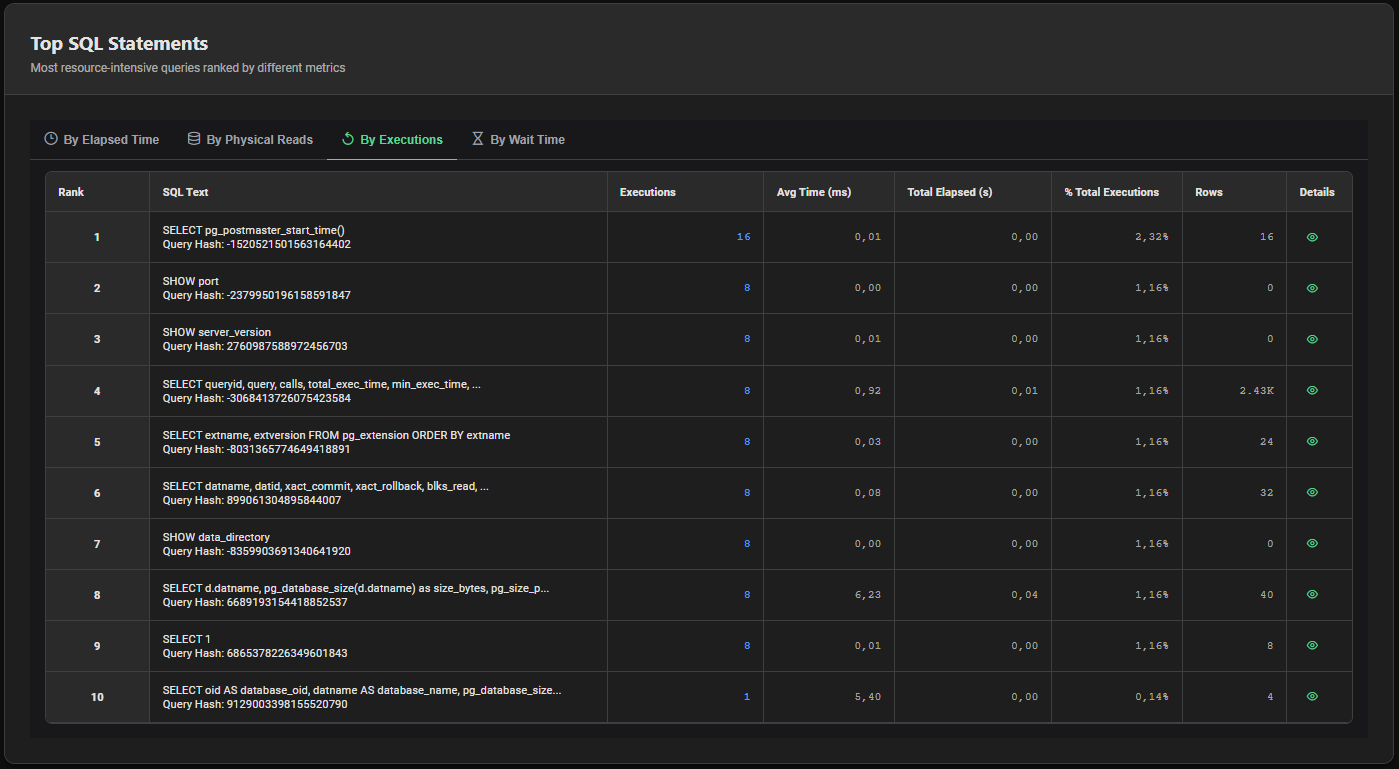
Tab 3 — By Executions
Ranks queries by total number of executions during the report period.
Best for: Identifying the highest-frequency queries — often small, fast queries that add up to significant cumulative load.
| Column | Description |
|---|---|
| Rank | Position by execution count |
| SQL Text | Normalized SQL text + Query Hash |
| Executions | Total execution count |
| Avg Time (ms) | Average elapsed time per execution |
| Total Elapsed (s) | Cumulative elapsed time in seconds |
| % Total Executions | Share of total executions across all statements |
| Rows | Total rows processed |
| Details | Button to open the SQL detail dialog |
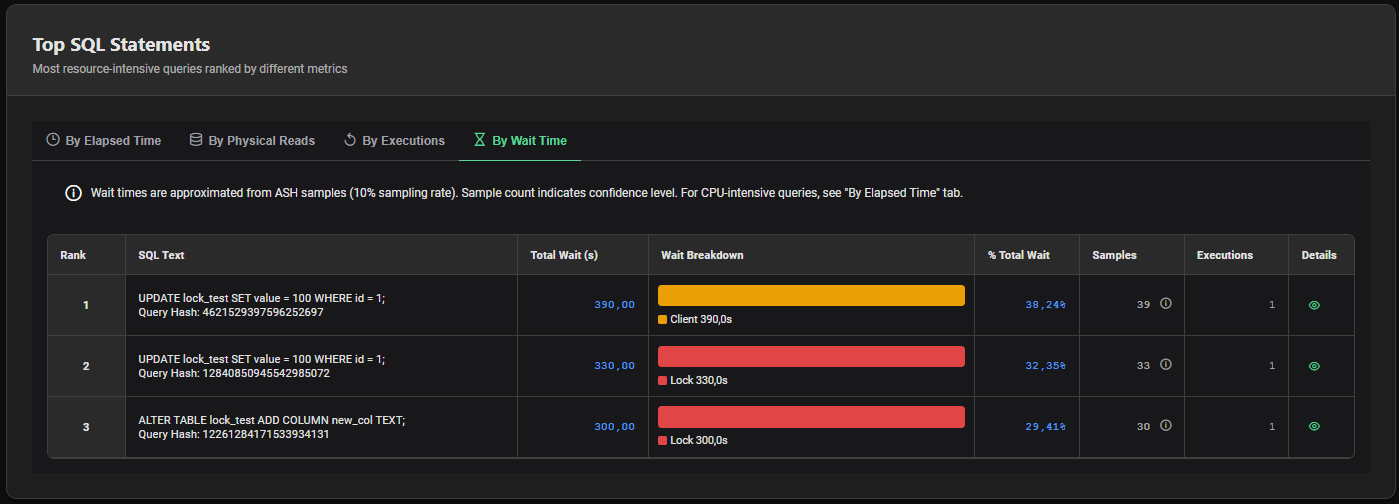
Tab 4 — By Wait Time
Ranks queries by total wait time observed in ASH samples during the report period.
Best for: Identifying queries blocked by I/O, locks or network waits — queries that are slow not because of CPU but because of contention.
Wait times in this tab are approximated from ASH samples at 10% sampling rate (1 sample every 10 seconds). The Samples column indicates the confidence level — a higher sample count means a more reliable estimate. For CPU-intensive queries, refer to the By Elapsed Time tab.
| Column | Description |
|---|---|
| Rank | Position by total wait time |
| SQL Text | Normalized SQL text + Query Hash |
| Total Wait (s) | Total wait time in seconds (ASH-based) |
| Wait Breakdown | Visual bar showing the distribution of wait types (I/O, Lock, Client, IPC, Other) with durations |
| % Total Wait | Share of total wait time across all statements |
| Samples | Number of ASH samples capturing this query — indicates estimation confidence |
| Executions | Number of executions |
| Details | Button to open the SQL detail dialog |
Wait Breakdown Bar
The Wait Breakdown column displays a color-coded bar showing how wait time is distributed across wait categories for each query:
| Color | Wait Category |
|---|---|
| 🔵 Blue | I/O wait |
| 🔴 Red | Lock wait |
| 🟠 Orange | Client wait |
| 🟣 Purple | IPC wait |
| ⚫ Dark Gray | Other waits |
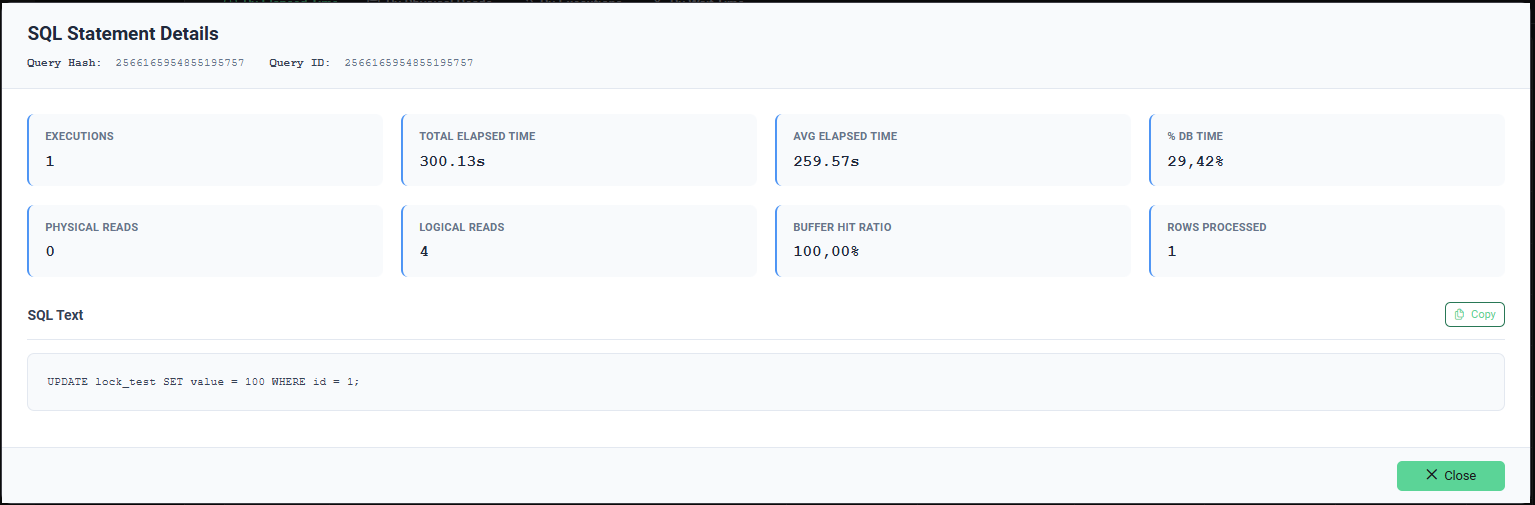
SQL Statement Detail Dialog
Click the eye icon (👁) on any row in any tab to open the full SQL statement detail dialog.
Header
| Field | Description |
|---|---|
| Query Hash | Hash of the normalized query text |
| Query ID | Internal PostgreSQL query identifier |
Metrics
| Metric | Description |
|---|---|
| Executions | Total number of executions during the report period |
| Total Elapsed Time | Cumulative execution time (formatted) |
| Avg Elapsed Time | Average time per execution (formatted) |
| % DB Time | Share of total DB Time attributed to this query |
| Physical Reads | Total blocks read from disk |
| Logical Reads | Total blocks read from buffer cache |
| Buffer Hit Ratio | Percentage of reads served from cache |
| Rows Processed | Total rows returned or affected |
SQL Text
The full normalized SQL text is displayed in a code block. A Copy button allows copying the full SQL text to the clipboard.
Interpreting the Results
High Elapsed Time, Low Executions
A few executions of a very slow query. Investigate the query execution plan — likely a missing index, a poorly optimized join or excessive data volume.
High Executions, Low Avg Time
High-frequency lightweight queries. Individually fast but potentially significant cumulative load. Consider connection pooling or query result caching at the application level.
High Physical Reads, Low Buffer Hit %
Query reading large amounts of data from disk. Suspect missing indexes causing sequential scans, or a working dataset that exceeds shared_buffers capacity.
High Wait Time (By Wait Time tab)
Query blocked on waits rather than CPU. Check the Wait Breakdown to identify the dominant wait type, then investigate Lock Contention or I/O subsystem accordingly.