VACUUM & Autovacuum Statistics
The VACUUM & Autovacuum Statistics section analyzes table maintenance activity during the report period. It helps identify tables that are not being vacuumed frequently enough, tables never vacuumed, and tables whose statistics are stale.
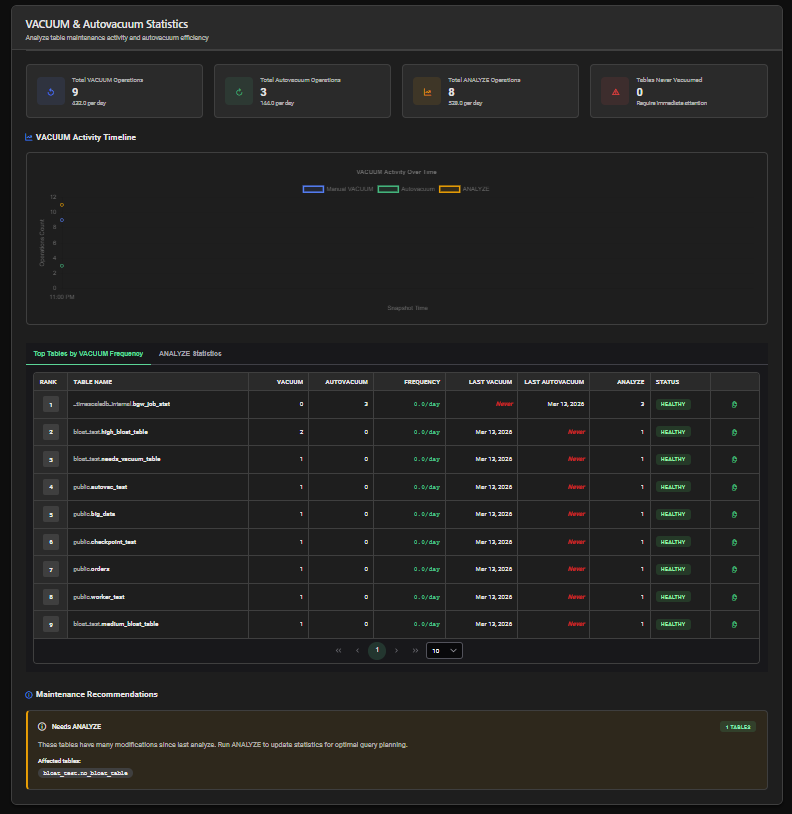
Summary Cards
| Card | Description |
|---|---|
| Total VACUUM Operations | Total manual VACUUM runs + average per day |
| Total Autovacuum Operations | Total autovacuum runs + average per day |
| Total ANALYZE Operations | Total ANALYZE runs (manual + auto) + average per day |
| Tables Never Vacuumed | Tables with no VACUUM history — highlighted in orange if > 0 |

VACUUM Activity Timeline
A line chart showing VACUUM and autovacuum activity over the report period, helping visualize maintenance patterns and identify periods of increased maintenance activity.
Tab 1 — Top Tables by VACUUM Frequency
Tables ranked by total VACUUM frequency during the report period.
| Column | Description |
|---|---|
| Rank | Position by VACUUM frequency |
| Table Name | Schema and table name |
| VACUUM | Total manual VACUUM runs |
| Autovacuum | Total autovacuum runs |
| Frequency | Combined VACUUM frequency per day |
| Last VACUUM | Timestamp of the last manual VACUUM |
| Last Autovacuum | Timestamp of the last autovacuum run |
| ANALYZE | Total ANALYZE + autoanalyze runs |
| Status | Table maintenance status badge |
| Script | Copy button to generate the VACUUM script |
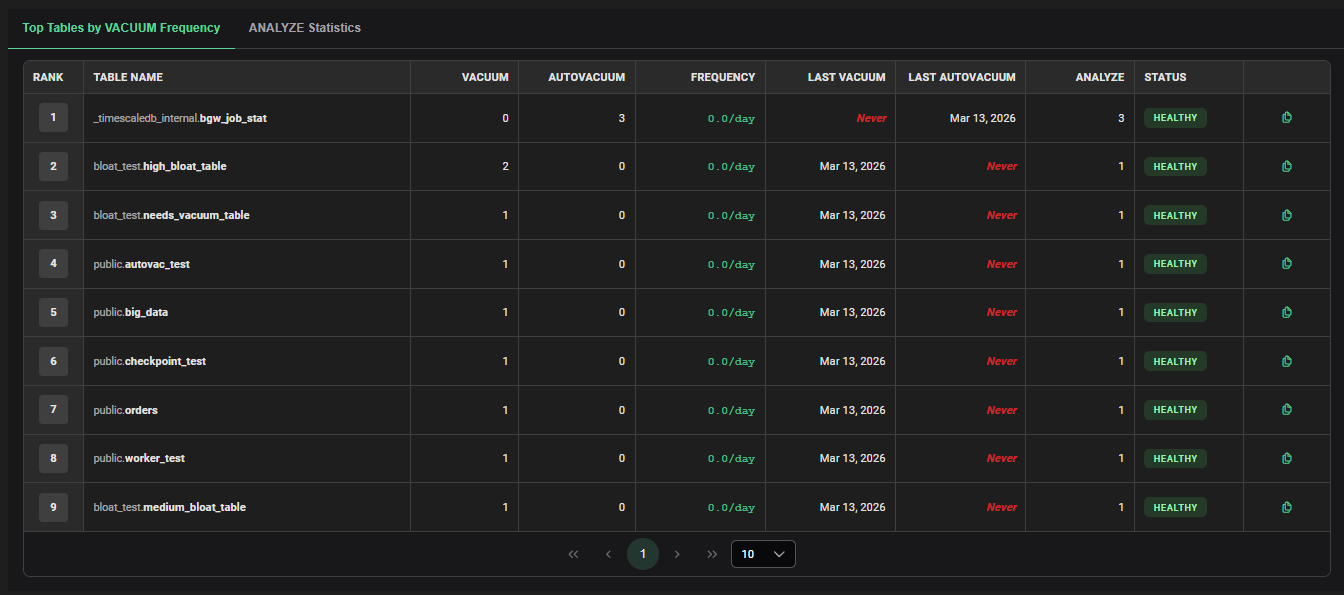
Table Status Values
| Status | Meaning |
|---|---|
| 🟢 OK | Table is well maintained |
| 🔵 MONITORED | Maintenance frequency is acceptable — continue monitoring |
| 🟠 NEEDS VACUUM | Table requires VACUUM soon |
| 🔴 CRITICAL | Table maintenance is overdue — immediate action required |
Tab 2 — Tables Never Vacuumed
This tab is visible only when at least one table has never been vacuumed. It lists all tables with no VACUUM history, ranked by urgency.
| Column | Description |
|---|---|
| Table Name | Schema and table name |
| Live Tuples | Average estimated live row count |
| Dead Tuples | Average estimated dead tuple count |
| Dead % | Percentage of dead tuples — highlighted in orange if ≥ 20% |
| Mods Since Analyze | Number of row modifications since the last ANALYZE |
| Urgency | Priority level for VACUUM action |
| Script | Copy button to generate the VACUUM script |
Urgency Levels
| Urgency | Meaning |
|---|---|
| 🔴 HIGH | Table has significant dead tuples — vacuum immediately |
| 🟠 MEDIUM | Table is accumulating dead tuples — vacuum soon |
| 🔵 LOW | Table has little activity — monitor |
Tables that have never been vacuumed and have high write activity can accumulate bloat rapidly and risk transaction ID wraparound — a critical PostgreSQL failure condition. Run VACUUM ANALYZE on these tables immediately and verify autovacuum is enabled.
Tab 3 — ANALYZE Statistics
Tables ranked by ANALYZE activity, with a focus on tables that need ANALYZE to refresh query planner statistics.
| Column | Description |
|---|---|
| Table Name | Schema and table name |
| ANALYZE | Total manual ANALYZE runs |
| Autoanalyze | Total autoanalyze runs |
| Last ANALYZE | Timestamp of the most recent ANALYZE (manual or auto) |
| Days Since | Days elapsed since the last ANALYZE — highlighted if > 7 days |
| Mods Since Analyze | Row modifications since the last ANALYZE — highlighted if > 10,000 |
| Needs ANALYZE | Yes (orange) if ANALYZE is recommended / No (green) if up to date |
| Script | Copy button to generate the ANALYZE script (when needed) |
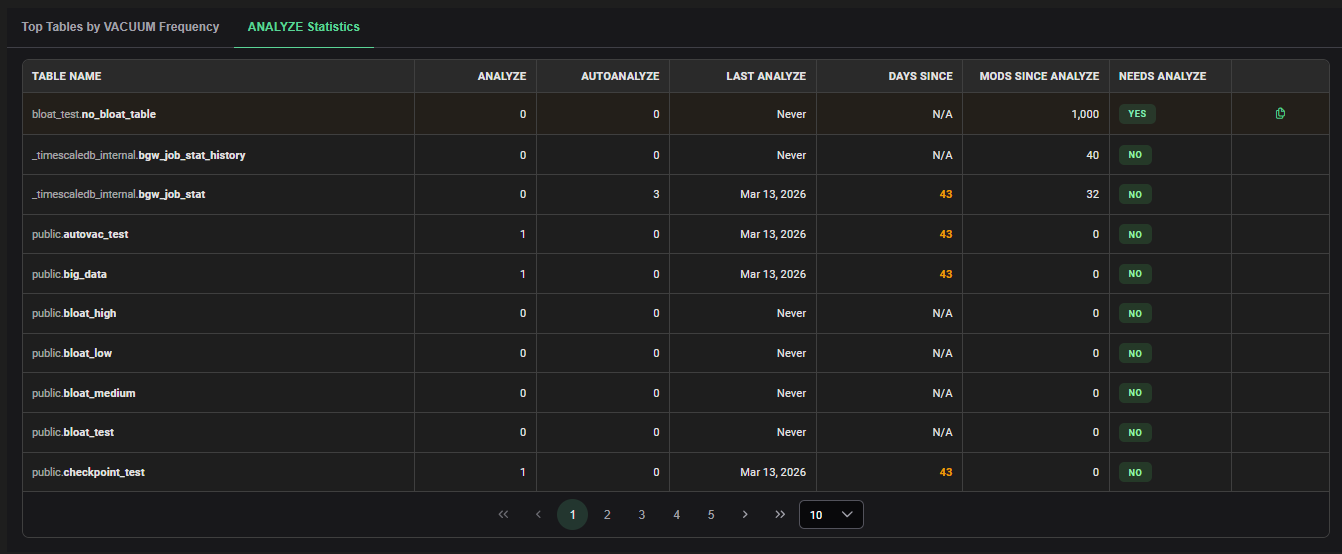
The PostgreSQL query planner uses statistics collected by ANALYZE to choose the best execution plan. Stale statistics (high Mods Since Analyze) lead the planner to make suboptimal decisions, resulting in slow queries. Ensure autoanalyze is enabled and configured appropriately for high-churn tables.
Maintenance Recommendations
Below the tabs, an automated Maintenance Recommendations section groups tables by recommendation type:
- Category — type of action needed
- Affected Tables Count — number of tables concerned
- Message — explanation of the recommendation
- Affected Tables — list of table names
When no recommendations are generated, a green confirmation message indicates all tables are properly maintained.
Interpretation Guide
High Autovacuum Frequency on the Same Table
A table running autovacuum very frequently indicates high write activity. Consider lowering autovacuum_vacuum_cost_delay for that table or increasing autovacuum_vacuum_scale_factor if the frequency is excessive.
Last VACUUM / Autovacuum Is Very Old
If a table has not been vacuumed for several days despite having write activity, autovacuum thresholds may be too conservative:
ALTER TABLE schema.table_name SET (
  autovacuum_vacuum_scale_factor = 0.01,
  autovacuum_vacuum_threshold = 100
);
High Mods Since Analyze
Stale statistics degrade query plan quality. Run ANALYZE manually or lower the autoanalyze threshold:
ANALYZE schema.table_name;
-- or adjust threshold:
ALTER TABLE schema.table_name SET (
  autovacuum_analyze_scale_factor = 0.01
);