Key Features
PMP4PG provides a comprehensive set of features designed around the daily needs of PostgreSQL database administrators and engineers.
Global Dashboard
A single-pane-of-glass view across your entire PostgreSQL fleet.
- KPI Cards — Total monitored servers, active servers, servers in error, active alerts
- Servers Grid — All servers with their status, environment, version and agent health at a glance
- Alert Summary — Recent and unresolved alerts surfaced directly on the dashboard
- Environment Awareness — Distinguish RUN (production) from BUILD (development/staging) environments
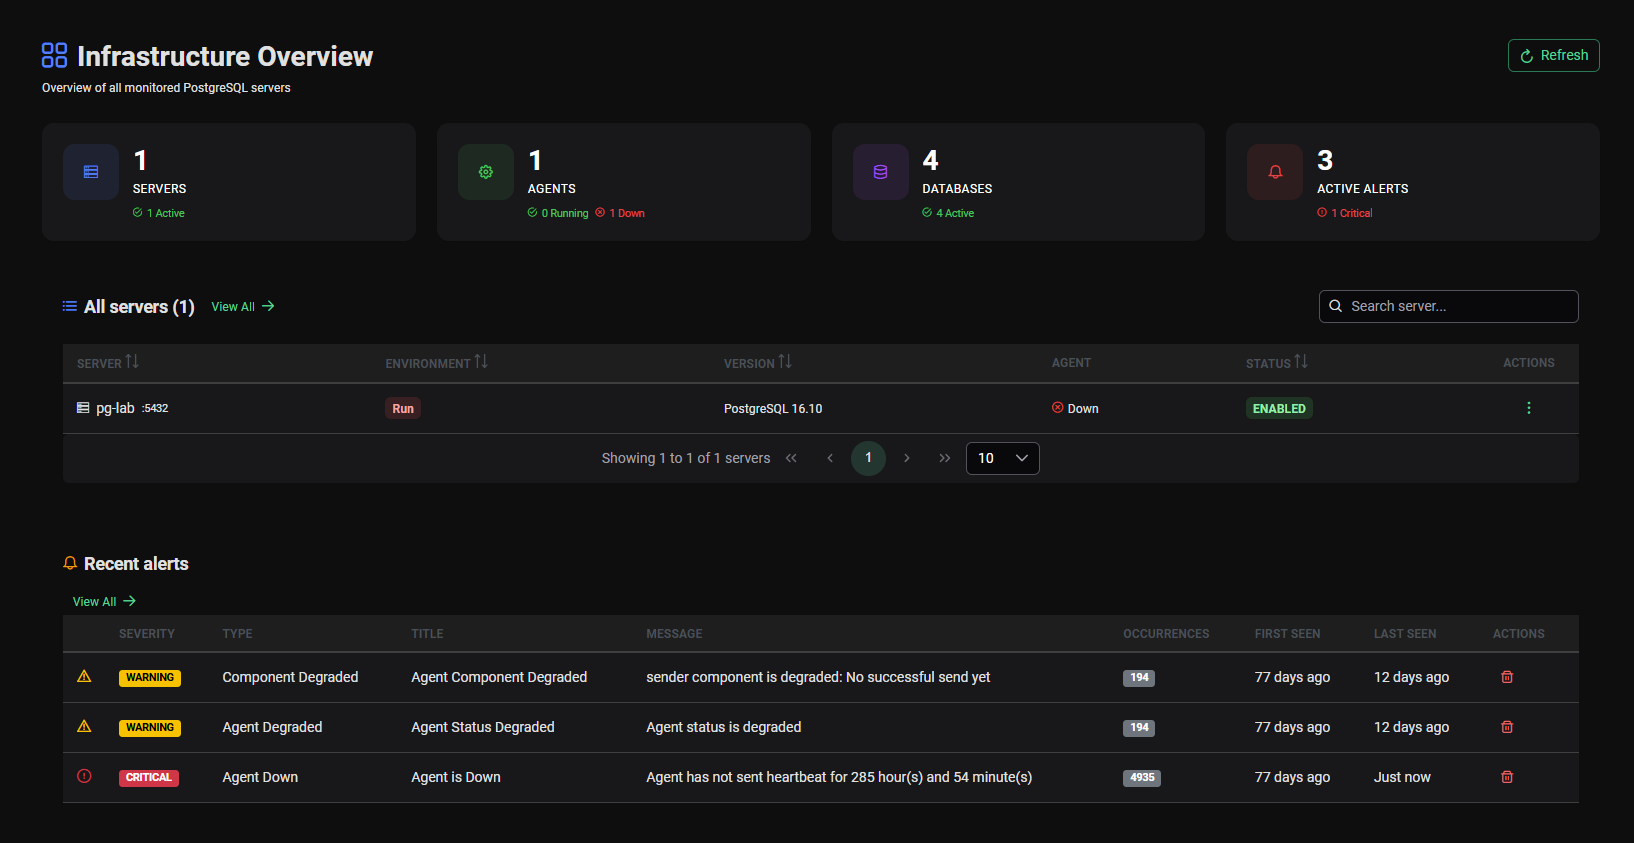
Global Dashboard — fleet overview with KPI cards and servers grid
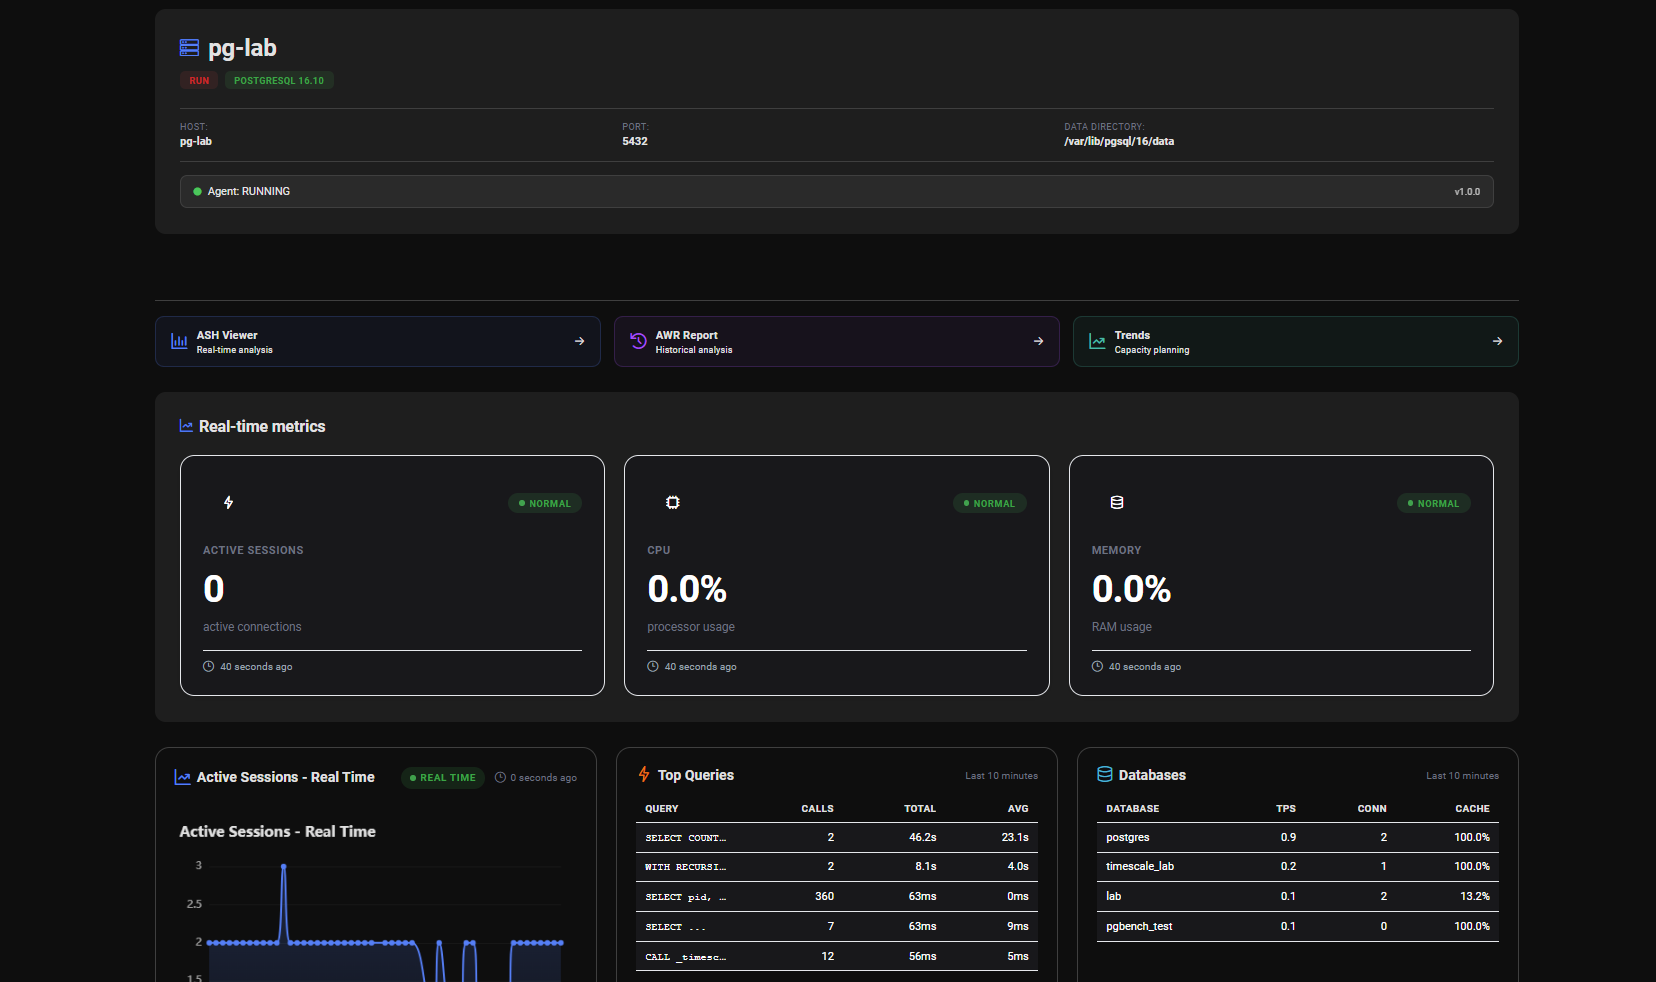
Server Detail
Drill into any monitored PostgreSQL server for a comprehensive view of its current state.
- Real-time server metrics
- Agent status and last heartbeat
- Detailed connection and activity information
- Quick navigation to ASH Viewer, AWR Viewer and Trends for that server
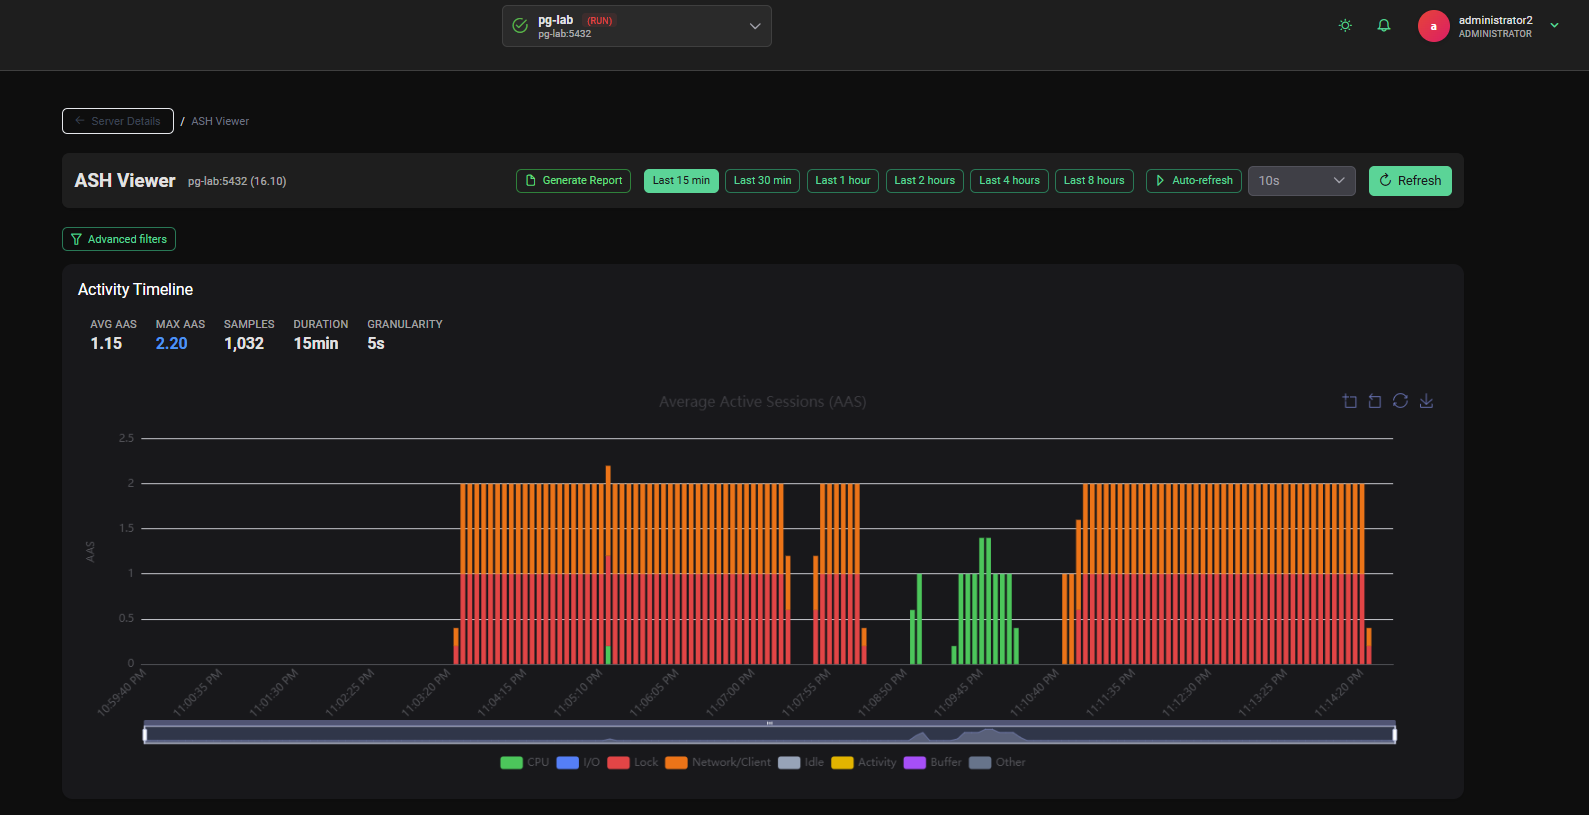
ASH Viewer — Real-Time Activity
Inspired by Oracle's Active Session History, the ASH Viewer gives you a live window into what your PostgreSQL instance is doing right now and over the recent past.
Time Windows
- Live refresh: every 5s, 10s, 30s or 60s
- Sliding windows: last 15 min, 30 min, 1h, 2h, 4h or 8h
- Custom zoom on any specific interval
Analysis Panels
- Activity Timeline — Interactive chart of active sessions over time, colored by wait event type
- Top 10 SQL — Most resource-consuming queries ranked by execution count, total time or average time
- Top Wait Events — Distribution of wait event types during the selected period
- Session States — Breakdown of active, idle, idle in transaction sessions
- Lock Contention — Identify blocking and blocked sessions
Export
- Generate and export a full ASH report as a standalone HTML file
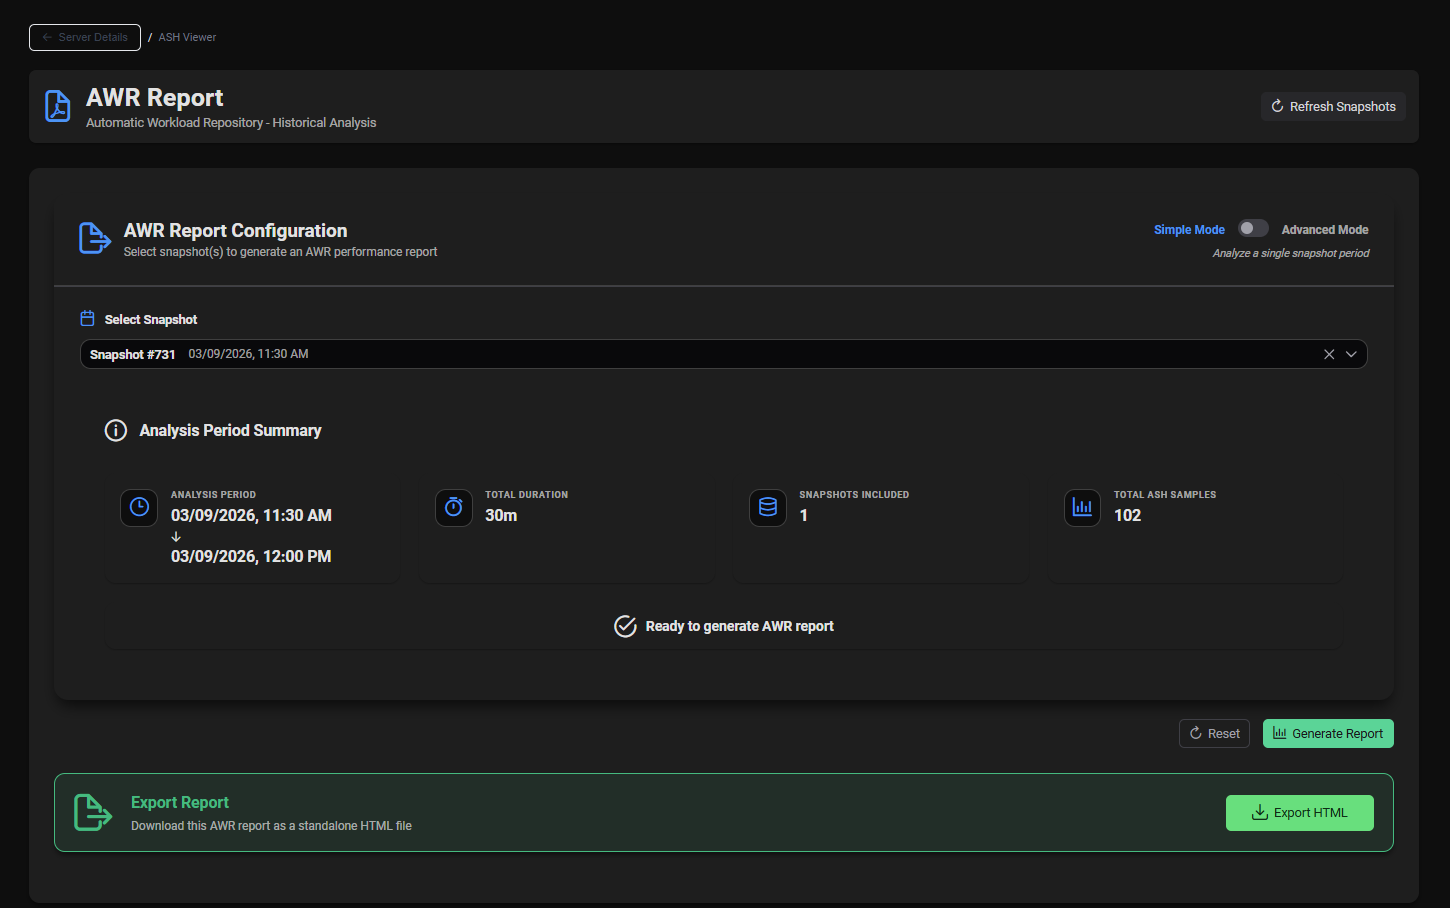
AWR Viewer — Proactive Workload Analysis
The AWR Viewer lets you generate Oracle AWR-style reports by comparing any two historical snapshots.
Report Sections
- Load Profile — Key throughput indicators (transactions/sec, reads/writes, SQL executions)
- Time Model Statistics — How database time is distributed across activity types
- Instance Efficiency — Cache hit ratios and efficiency indicators
- Top SQL — Top queries ranked by elapsed time, CPU time, executions, rows processed and I/O
- Wait Events Statistics — Ranked wait events for the snapshot period
- Lock Contention Analysis — Lock wait frequency and duration
- Bloat Analysis — Table and index bloat estimation
- Vacuum Statistics — Vacuum and autovacuum activity
- WAL Activity — WAL generation rates and checkpoint statistics
- Segment I/O — Per-table and per-index I/O statistics
Export
- Full report exportable as a standalone HTML file — shareable and archivable
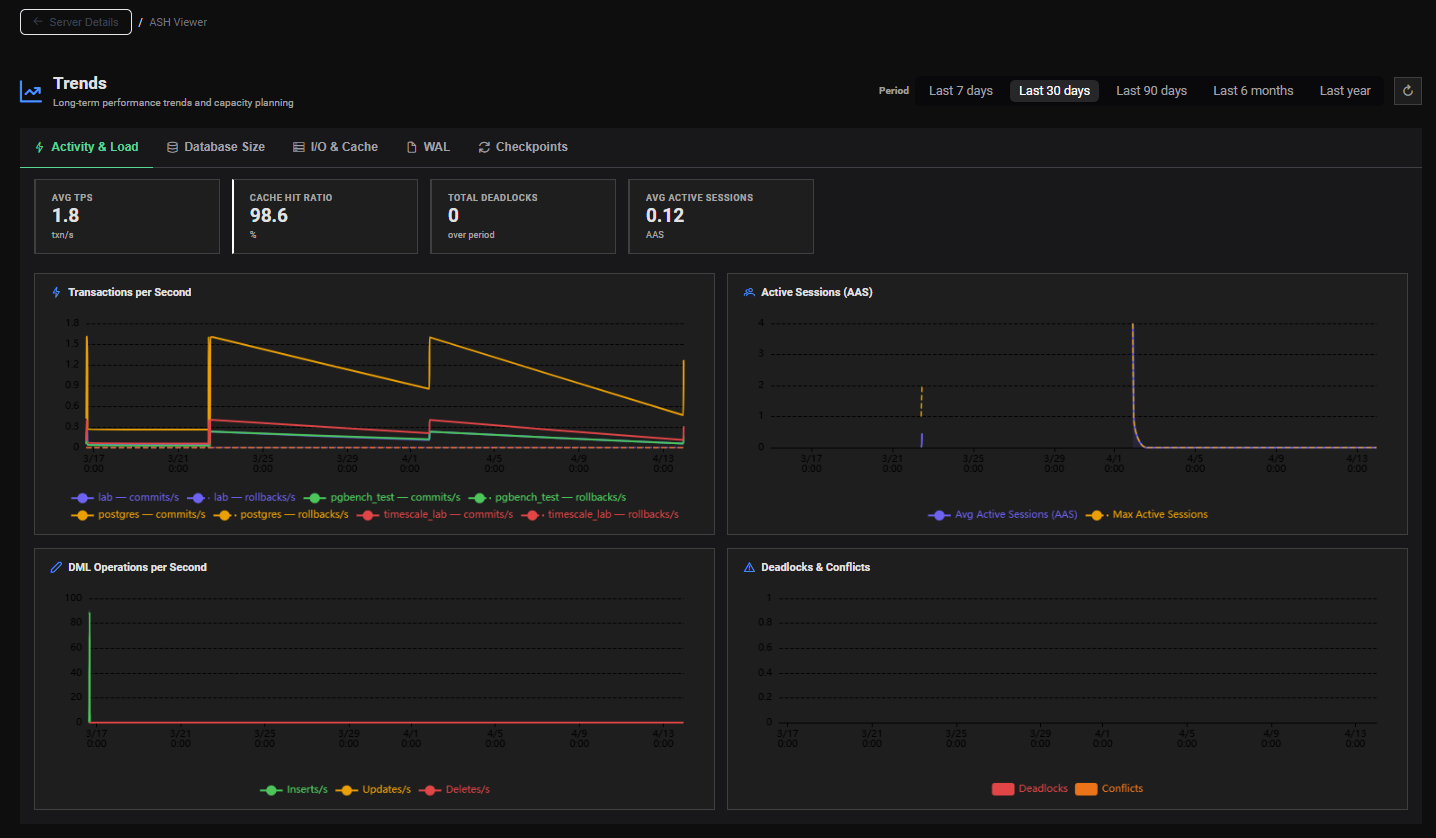
Trends
Visualize the long-term evolution of your PostgreSQL instances with chart-based trend analysis.
- Database Size — Track how your databases grow over time
- Activity & Throughput — Reads, writes, commits, rollbacks trends
- WAL Generation — Monitor WAL volume trends for I/O and replication planning
- Configurable periods — Last 7 days, 30 days, 90 days or custom date range
- Organized by thematic tabs for easy navigation
Lightweight Go Agent
Each monitored PostgreSQL server runs a small, self-contained agent written in Go.
What it collects
| Metric Source | Default Frequency | Purpose |
|---|---|---|
pg_stat_activity | Every second (Configurable) | ASH samples (real-time) |
pg_stat_statements | Every minute (delta) | Query-level performance |
pg_stat_database | Every minute (delta) | Database-level throughput |
pg_database_size | 10 minutes (Configurable) | Database size tracking |
| OS Metrics | Every minute (Configurable) | System-level context |
| Server Snapshot | Every 30 minutes | AWR snapshot base |
Agent characteristics
- Single binary, no runtime dependencies
- Configurable via a simple YAML file
- Self-registration with the central platform
- Gzip-compressed payloads for minimal network footprint
- Automatic retry with exponential backoff on network failure
Alerts
- Centralized list of alerts across all monitored servers
- Alert deletion / acknowledgment
- Visible from both the Global Dashboard and the dedicated Alerts page
User Management
- Multi-user access to the platform
- User list administration
- Secure login to the web interface
Next Steps
- Understand the Architecture →
- See Who PMP4PG is for →
- Get Started →