Server Detail
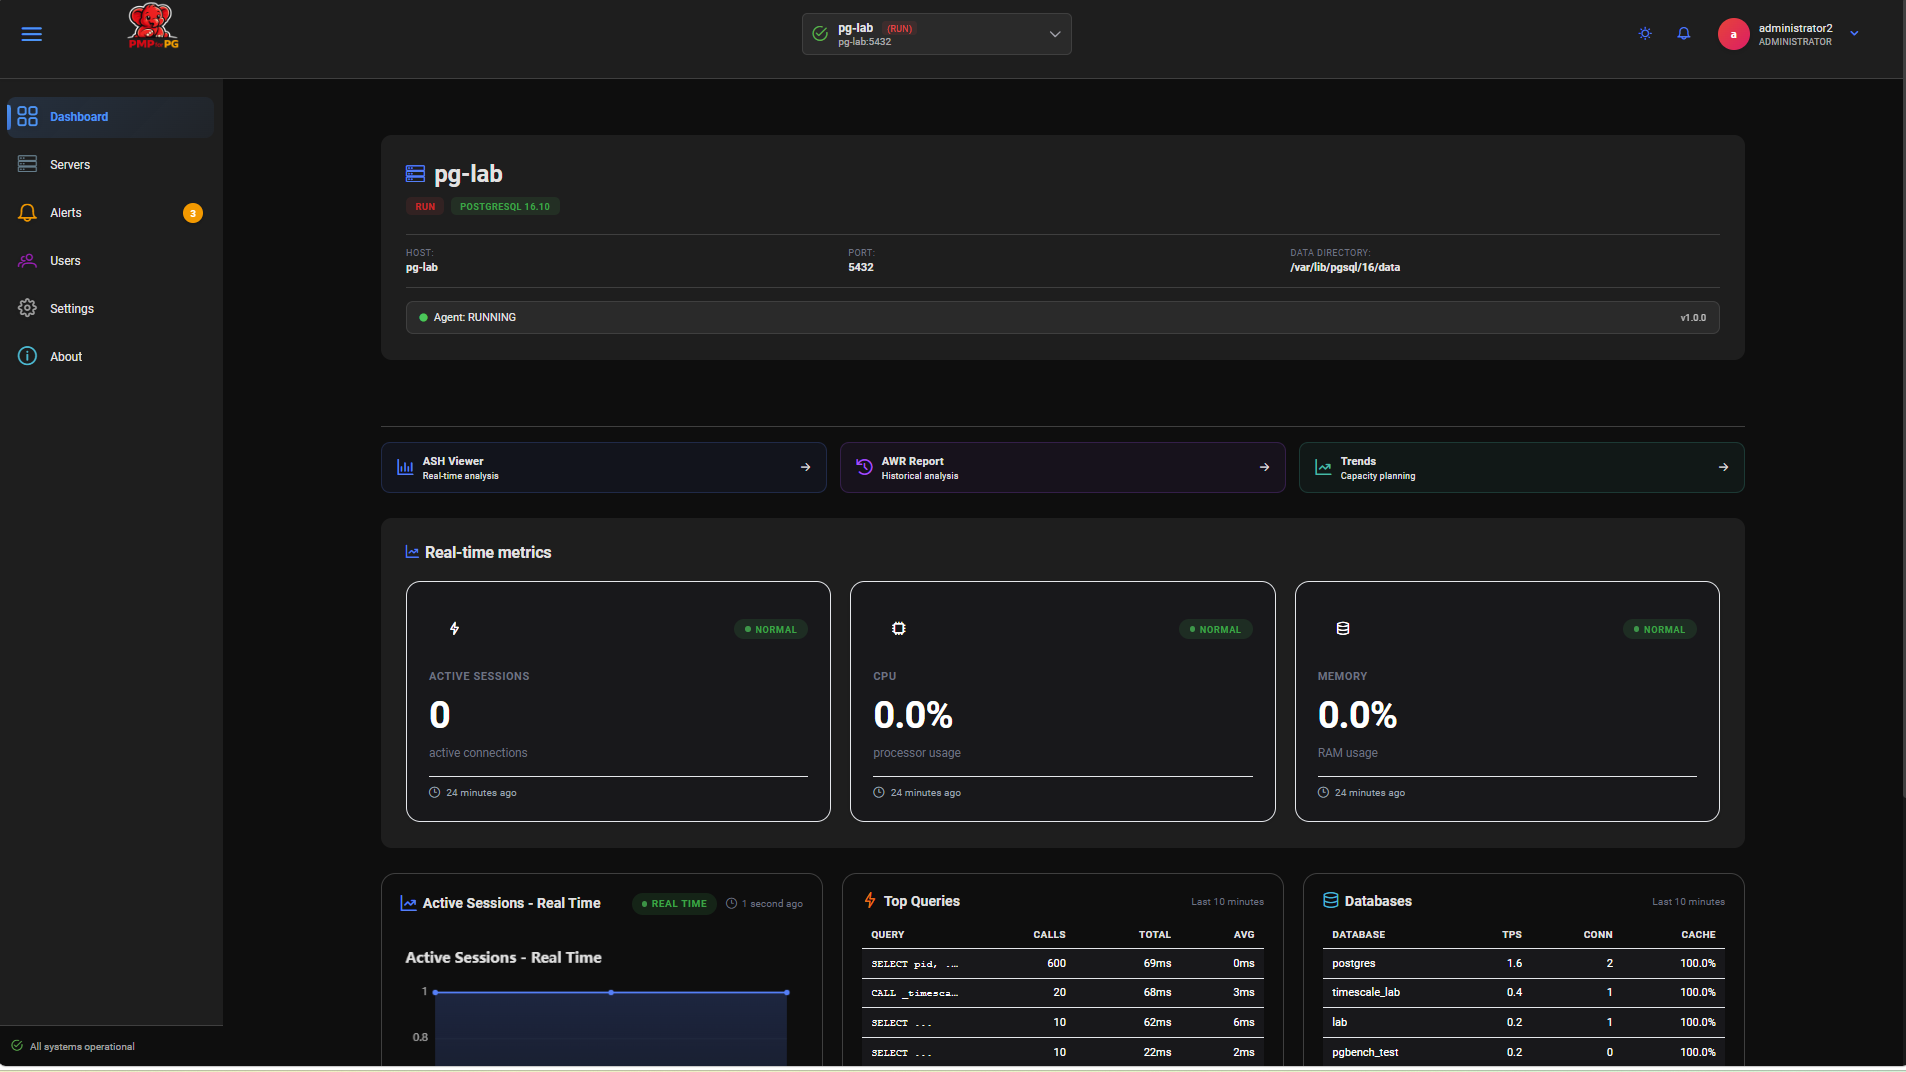
The Server Detail page provides a comprehensive view of a single monitored PostgreSQL server — its current health, real-time metrics, top queries and database statistics. Everything is displayed on a single scrollable page.
Accessing Server Detail
From the Global Dashboard, click on any server row to open its detail page.
1. Server Header
The header displays the full identity and current state of the server at a glance.
| Field | Example | Description |
|---|---|---|
| Server Name | pg-lab | Server display name as registered in the platform |
| Status | RUN | Environment — RUN (production) or BUILD (non-production) |
| PostgreSQL Version | PostgreSQL 16.10 | Detected PostgreSQL version |
| Host | pg-lab | Hostname of the monitored server |
| Port | 5432 | PostgreSQL listening port |
| Data Directory | /var/lib/pgsql/16/data | PostgreSQL data directory path |
| Agent Status | RUNNING | Current agent status |
| Agent Version | v1.0.0 | Installed agent version |
2. Quick Navigation
Three buttons at the top of the page provide direct access to the analysis tools for this server:
| Button | Destination |
|---|---|
| ASH Viewer | Real-time activity monitoring for this server |
| AWR Viewer | Proactive workload reports for this server |
| Trends | Long-term evolution charts for this server |
Clicking these buttons automatically selects the current server — no need to use the server selector dropdown on the analysis pages.
3. Real-Time Metric Cards
Three summary cards display the current state of the server, refreshed automatically:
| Card | Description |
|---|---|
| Active Sessions | Number of sessions currently active on the PostgreSQL instance |
| CPU Usage | Current CPU utilization of the server host |
| Memory Usage | Current memory utilization of the server host |
4. Active Sessions — Real-Time Chart
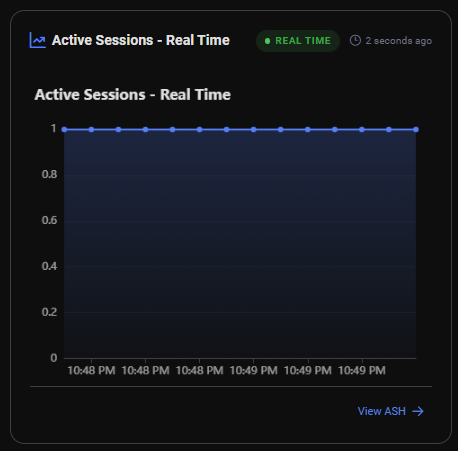
A live chart showing the number of active sessions over the last 5 minutes, refreshed every 3 seconds.
This gives an immediate visual of current database activity and helps detect sudden session spikes before they become incidents.
5. Top Queries
A table of the Top 5 SQL queries currently observed on the instance, ranked by total execution time.
| Column | Description |
|---|---|
| Query | Normalized SQL text (truncated) |
| Calls | Total number of executions |
| Total Time | Cumulative execution time |
| Avg Time | Average execution time per call |
Query Detail
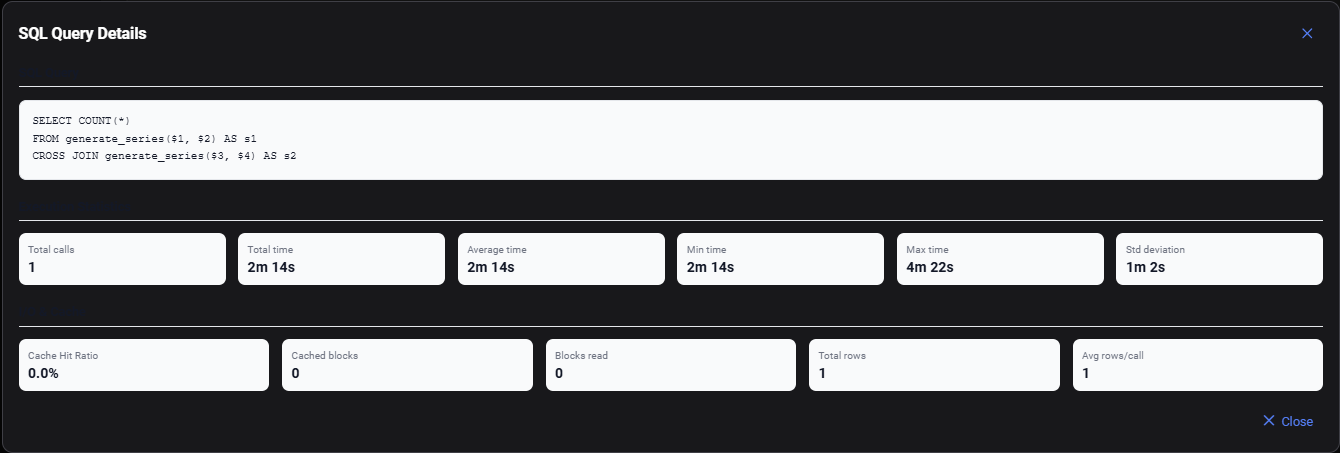
Click on any query row to expand its full detail panel:
SQL Query Full normalized SQL text of the statement.
Execution Statistics
| Metric | Description |
|---|---|
| Total Calls | Total number of executions |
| Total Time | Cumulative execution time |
| Average Time | Average time per execution |
| Min Time | Fastest execution observed |
| Max Time | Slowest execution observed |
| Std Deviation | Execution time variability |
I/O & Cache
| Metric | Description |
|---|---|
| Cache Hit Ratio | Percentage of block reads served from buffer cache |
| Cached Blocks | Blocks read from buffer cache |
| Blocks Read | Blocks read from disk |
| Total Rows | Total rows returned across all executions |
| Avg Rows/Call | Average rows returned per execution |
6. Database Statistics
A table of the Top 5 databases on the instance with key throughput indicators.
| Column | Description |
|---|---|
| Database | Database name |
| TPS | Transactions per second |
| CON | Number of active connections |
| Cache | Buffer cache hit ratio |
Database Detail
Click on any database row to expand its full statistics panel:
Main Metrics
| Metric | Description |
|---|---|
| TPS | Transactions per second |
| Active Connections | Current number of active connections |
| Cache Hit Ratio | Buffer cache efficiency percentage |
| Modified Tuples | Rows modified (INSERT + UPDATE + DELETE) |
Transactions
| Metric | Description |
|---|---|
| Commits | Total committed transactions |
| Rollbacks | Total rolled-back transactions |
| Total Transactions | Commits + Rollbacks |
I/O & Cache
| Metric | Description |
|---|---|
| Cached Blocks (hit) | Blocks served from buffer cache |
| Blocks Read (disk) | Blocks read from disk |
| Read Time (ms) | Time spent reading from disk |
| Write Time (ms) | Time spent writing to disk |
Tuple Activity
| Metric | Description |
|---|---|
| Rows Returned | Total rows returned by queries |
| Rows Fetched | Total rows fetched by queries |
| Rows Inserted | Total rows inserted |
| Rows Updated | Total rows updated |
| Rows Deleted | Total rows deleted |
Temporary Files
| Metric | Description |
|---|---|
| Number of Temp Files | Temporary files created (indicates sort/hash spills) |
| Total Size | Total size of temporary files |
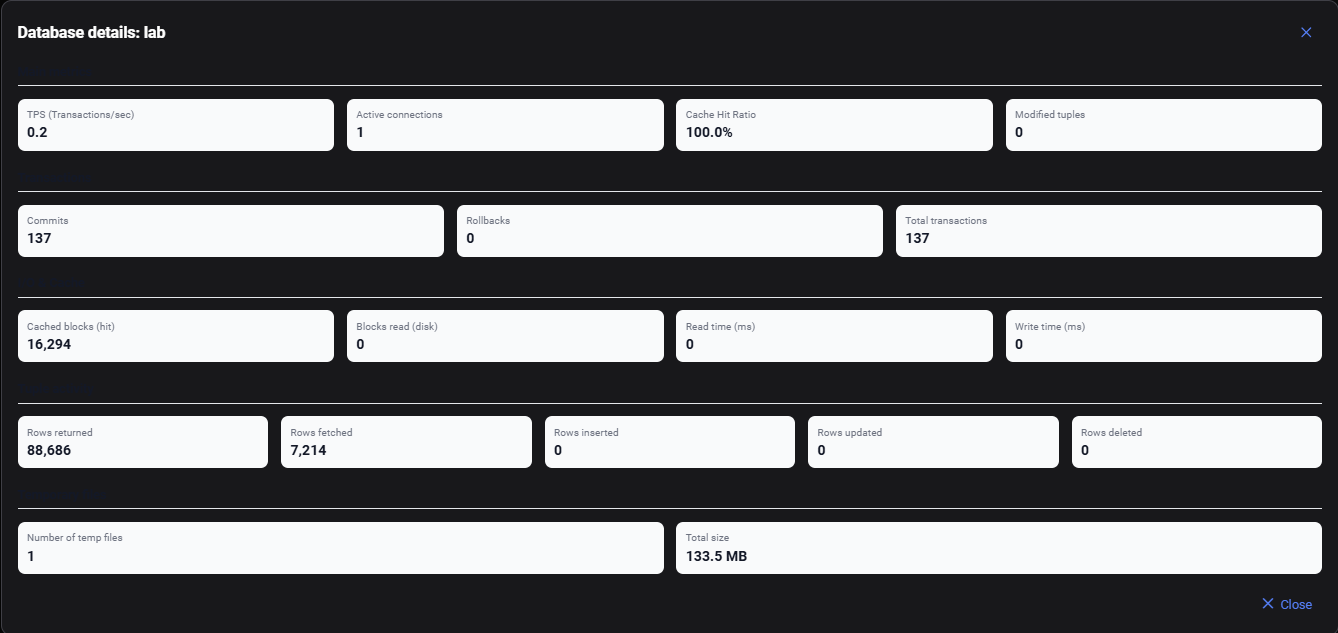
A high number of temporary files indicates that queries are spilling to disk during sort or hash operations. Consider increasing work_mem in postgresql.conf or reviewing query plans for missing indexes.