I/O & Cache Trends
The I/O & Cache tab tracks the evolution of buffer cache efficiency and disk I/O activity over the selected time period. It helps detect gradual cache degradation and identifies periods of excessive disk reads or temporary file usage.
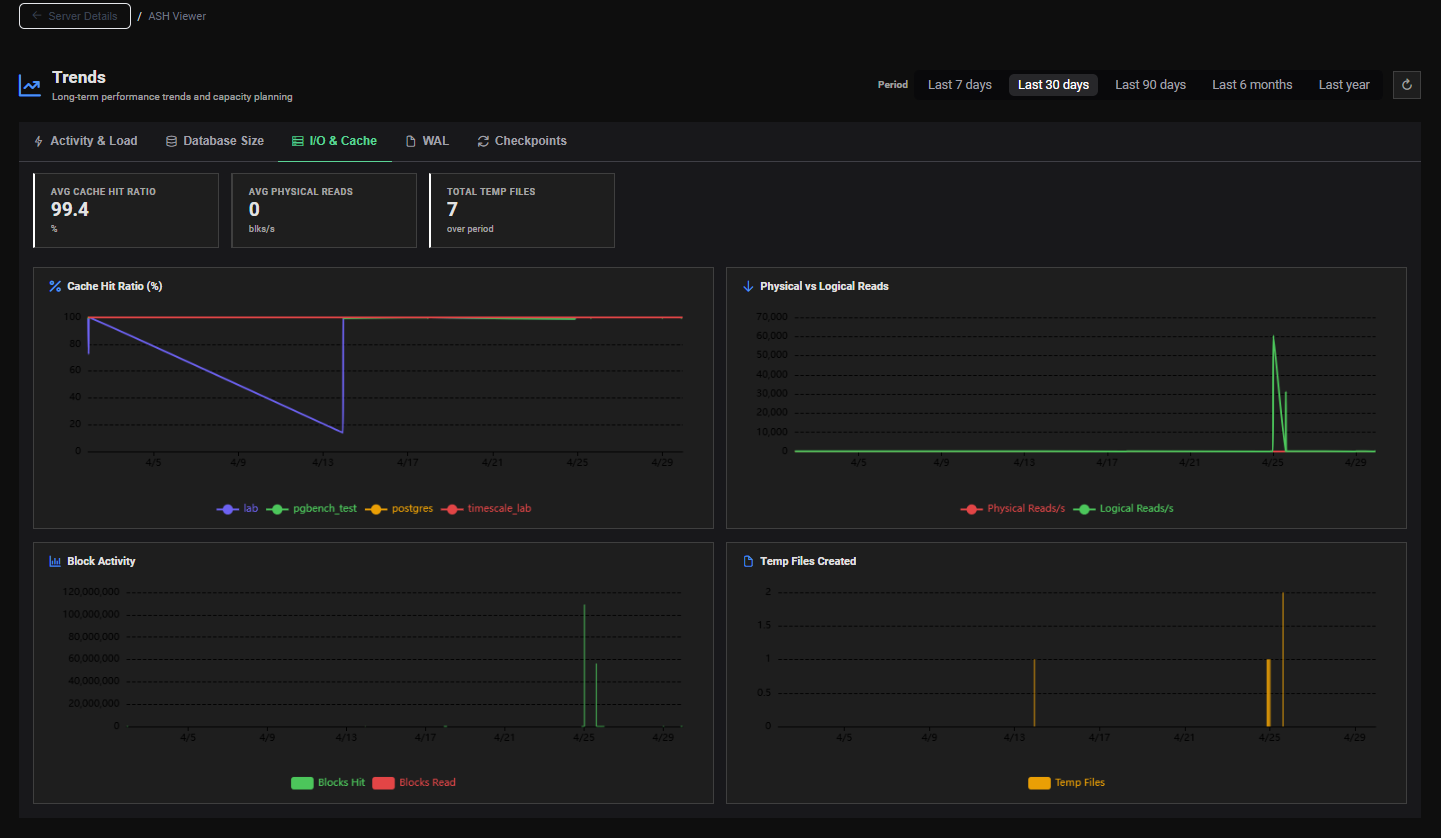
KPI Summary Cards
Three summary cards display period-wide aggregates:
| Card | Unit | Condition | Description |
|---|---|---|---|
| Avg Cache Hit Ratio | % | Color-coded by severity | Average buffer cache hit ratio over the selected period |
| Avg Physical Reads | blks/s | 🟠 Orange if > 100 blks/s | Average rate of blocks read from disk per second |
| Total Temp Files | count | 🟠 Orange if > 0 | Total temporary files created during the period |
Cache Hit Ratio Severity
| Value | Color | Meaning |
|---|---|---|
| ≥ 95% | 🟢 Green | Excellent — data mostly served from memory |
| 90–95% | 🔵 Blue | Good — acceptable cache efficiency |
| 80–90% | 🟠 Orange | Warning — notable disk reads |
| < 80% | 🔴 Red | Critical — heavy disk I/O |
Charts
Chart 1 — Cache Hit Ratio (%)
A line chart showing the buffer cache hit ratio evolution over time.
Use for:
- Detecting a gradual decline in cache efficiency as the working dataset grows
- Identifying specific periods where cache hit ratio dropped sharply
- Validating that a
shared_buffersincrease improved cache performance - Capacity planning — projecting when the working dataset will outgrow available memory
A declining cache hit ratio trend over weeks is a leading indicator that shared_buffers needs to be increased or that new queries are performing large sequential scans that pollute the cache.
Chart 2 — Physical vs Logical Reads
A dual-line chart comparing physical block reads (from disk) vs logical block reads (from cache) over time.
Use for:
- Visualizing the ratio between cache hits and disk reads over time
- Identifying spikes in physical reads that correspond to specific workload events
- Detecting whether physical read growth is proportional to logical read growth (healthy scaling) or disproportionate (cache degradation)
In a well-tuned system, logical reads should be orders of magnitude higher than physical reads. If the gap narrows over time, the buffer cache is becoming less effective relative to the workload.
Chart 3 — Block Activity
A line chart showing the overall block read and write activity over time (total blocks hit + blocks read, and blocks written).
Use for:
- Understanding total I/O volume trends on the instance
- Identifying write-heavy periods that may stress the I/O subsystem
- Correlating block activity peaks with checkpoint frequency (see Checkpoint & WAL Statistics in AWR)
- Capacity planning for storage I/O throughput
Chart 4 — Temp Files Created
A bar chart showing the number of temporary files created over time.
Use for:
- Detecting recurring periods where queries spill to disk during sort or hash operations
- Identifying whether temp file usage is growing over time (more complex queries, larger datasets)
- Validating that a
work_memincrease eliminated temp file creation
Each temporary file represents a query that ran out of work_mem and had to spill data to disk. This adds significant I/O overhead and slows query execution. A non-zero and growing trend warrants investigation.
To identify queries generating temp files:
SELECT query,
       temp_blks_read,
       temp_blks_written,
       calls
FROM pg_stat_statements
WHERE temp_blks_written > 0
ORDER BY temp_blks_written DESC
LIMIT 10;
Interpretation Guide
Declining Cache Hit Ratio + Rising Physical Reads
The working dataset is growing beyond shared_buffers. Options:
- Increase
shared_buffers(up to 25–40% of RAM) - Review Top SQL for large sequential scans that pollute the cache
- Consider partitioning large tables to keep hot data in cache
High Physical Reads on Specific Periods
Cross-reference the spike timestamp with the AWR Viewer for that period. Check Segment Statistics for tables with low cache hit ratios and Top SQL by Physical Reads for offending queries.
Persistent Temp File Creation
Increase work_mem for sessions performing complex sorts or hash joins. Apply selectively to avoid memory pressure:
-- Per session
SET work_mem = '64MB';

-- Per user
ALTER USER analyst SET work_mem = '256MB';